- Research Process
- Manuscript Preparation
- Manuscript Review
- Publication Process
- Publication Recognition
- Language Editing Services
- Translation Services


Systematic Literature Review or Literature Review?
- 3 minute read
- 52.2K views
Table of Contents
As a researcher, you may be required to conduct a literature review. But what kind of review do you need to complete? Is it a systematic literature review or a standard literature review? In this article, we’ll outline the purpose of a systematic literature review, the difference between literature review and systematic review, and other important aspects of systematic literature reviews.
What is a Systematic Literature Review?
The purpose of systematic literature reviews is simple. Essentially, it is to provide a high-level of a particular research question. This question, in and of itself, is highly focused to match the review of the literature related to the topic at hand. For example, a focused question related to medical or clinical outcomes.
The components of a systematic literature review are quite different from the standard literature review research theses that most of us are used to (more on this below). And because of the specificity of the research question, typically a systematic literature review involves more than one primary author. There’s more work related to a systematic literature review, so it makes sense to divide the work among two or three (or even more) researchers.
Your systematic literature review will follow very clear and defined protocols that are decided on prior to any review. This involves extensive planning, and a deliberately designed search strategy that is in tune with the specific research question. Every aspect of a systematic literature review, including the research protocols, which databases are used, and dates of each search, must be transparent so that other researchers can be assured that the systematic literature review is comprehensive and focused.
Most systematic literature reviews originated in the world of medicine science. Now, they also include any evidence-based research questions. In addition to the focus and transparency of these types of reviews, additional aspects of a quality systematic literature review includes:
- Clear and concise review and summary
- Comprehensive coverage of the topic
- Accessibility and equality of the research reviewed
Systematic Review vs Literature Review
The difference between literature review and systematic review comes back to the initial research question. Whereas the systematic review is very specific and focused, the standard literature review is much more general. The components of a literature review, for example, are similar to any other research paper. That is, it includes an introduction, description of the methods used, a discussion and conclusion, as well as a reference list or bibliography.
A systematic review, however, includes entirely different components that reflect the specificity of its research question, and the requirement for transparency and inclusion. For instance, the systematic review will include:
- Eligibility criteria for included research
- A description of the systematic research search strategy
- An assessment of the validity of reviewed research
- Interpretations of the results of research included in the review
As you can see, contrary to the general overview or summary of a topic, the systematic literature review includes much more detail and work to compile than a standard literature review. Indeed, it can take years to conduct and write a systematic literature review. But the information that practitioners and other researchers can glean from a systematic literature review is, by its very nature, exceptionally valuable.
This is not to diminish the value of the standard literature review. The importance of literature reviews in research writing is discussed in this article . It’s just that the two types of research reviews answer different questions, and, therefore, have different purposes and roles in the world of research and evidence-based writing.
Systematic Literature Review vs Meta Analysis
It would be understandable to think that a systematic literature review is similar to a meta analysis. But, whereas a systematic review can include several research studies to answer a specific question, typically a meta analysis includes a comparison of different studies to suss out any inconsistencies or discrepancies. For more about this topic, check out Systematic Review VS Meta-Analysis article.
Language Editing Plus
With Elsevier’s Language Editing Plus services , you can relax with our complete language review of your systematic literature review or literature review, or any other type of manuscript or scientific presentation. Our editors are PhD or PhD candidates, who are native-English speakers. Language Editing Plus includes checking the logic and flow of your manuscript, reference checks, formatting in accordance to your chosen journal and even a custom cover letter. Our most comprehensive editing package, Language Editing Plus also includes any English-editing needs for up to 180 days.

How to Make a PowerPoint Presentation of Your Research Paper

What is and How to Write a Good Hypothesis in Research?
You may also like.

Descriptive Research Design and Its Myriad Uses

Five Common Mistakes to Avoid When Writing a Biomedical Research Paper

Making Technical Writing in Environmental Engineering Accessible

To Err is Not Human: The Dangers of AI-assisted Academic Writing

When Data Speak, Listen: Importance of Data Collection and Analysis Methods

Choosing the Right Research Methodology: A Guide for Researchers

Why is data validation important in research?

Writing a good review article
Input your search keywords and press Enter.
Have a language expert improve your writing
Run a free plagiarism check in 10 minutes, generate accurate citations for free.
- Knowledge Base
Methodology
- Systematic Review | Definition, Example, & Guide
Systematic Review | Definition, Example & Guide
Published on June 15, 2022 by Shaun Turney . Revised on November 20, 2023.
A systematic review is a type of review that uses repeatable methods to find, select, and synthesize all available evidence. It answers a clearly formulated research question and explicitly states the methods used to arrive at the answer.
They answered the question “What is the effectiveness of probiotics in reducing eczema symptoms and improving quality of life in patients with eczema?”
In this context, a probiotic is a health product that contains live microorganisms and is taken by mouth. Eczema is a common skin condition that causes red, itchy skin.
Table of contents
What is a systematic review, systematic review vs. meta-analysis, systematic review vs. literature review, systematic review vs. scoping review, when to conduct a systematic review, pros and cons of systematic reviews, step-by-step example of a systematic review, other interesting articles, frequently asked questions about systematic reviews.
A review is an overview of the research that’s already been completed on a topic.
What makes a systematic review different from other types of reviews is that the research methods are designed to reduce bias . The methods are repeatable, and the approach is formal and systematic:
- Formulate a research question
- Develop a protocol
- Search for all relevant studies
- Apply the selection criteria
- Extract the data
- Synthesize the data
- Write and publish a report
Although multiple sets of guidelines exist, the Cochrane Handbook for Systematic Reviews is among the most widely used. It provides detailed guidelines on how to complete each step of the systematic review process.
Systematic reviews are most commonly used in medical and public health research, but they can also be found in other disciplines.
Systematic reviews typically answer their research question by synthesizing all available evidence and evaluating the quality of the evidence. Synthesizing means bringing together different information to tell a single, cohesive story. The synthesis can be narrative ( qualitative ), quantitative , or both.
Receive feedback on language, structure, and formatting
Professional editors proofread and edit your paper by focusing on:
- Academic style
- Vague sentences
- Style consistency
See an example

Systematic reviews often quantitatively synthesize the evidence using a meta-analysis . A meta-analysis is a statistical analysis, not a type of review.
A meta-analysis is a technique to synthesize results from multiple studies. It’s a statistical analysis that combines the results of two or more studies, usually to estimate an effect size .
A literature review is a type of review that uses a less systematic and formal approach than a systematic review. Typically, an expert in a topic will qualitatively summarize and evaluate previous work, without using a formal, explicit method.
Although literature reviews are often less time-consuming and can be insightful or helpful, they have a higher risk of bias and are less transparent than systematic reviews.
Similar to a systematic review, a scoping review is a type of review that tries to minimize bias by using transparent and repeatable methods.
However, a scoping review isn’t a type of systematic review. The most important difference is the goal: rather than answering a specific question, a scoping review explores a topic. The researcher tries to identify the main concepts, theories, and evidence, as well as gaps in the current research.
Sometimes scoping reviews are an exploratory preparation step for a systematic review, and sometimes they are a standalone project.
A systematic review is a good choice of review if you want to answer a question about the effectiveness of an intervention , such as a medical treatment.
To conduct a systematic review, you’ll need the following:
- A precise question , usually about the effectiveness of an intervention. The question needs to be about a topic that’s previously been studied by multiple researchers. If there’s no previous research, there’s nothing to review.
- If you’re doing a systematic review on your own (e.g., for a research paper or thesis ), you should take appropriate measures to ensure the validity and reliability of your research.
- Access to databases and journal archives. Often, your educational institution provides you with access.
- Time. A professional systematic review is a time-consuming process: it will take the lead author about six months of full-time work. If you’re a student, you should narrow the scope of your systematic review and stick to a tight schedule.
- Bibliographic, word-processing, spreadsheet, and statistical software . For example, you could use EndNote, Microsoft Word, Excel, and SPSS.
A systematic review has many pros .
- They minimize research bias by considering all available evidence and evaluating each study for bias.
- Their methods are transparent , so they can be scrutinized by others.
- They’re thorough : they summarize all available evidence.
- They can be replicated and updated by others.
Systematic reviews also have a few cons .
- They’re time-consuming .
- They’re narrow in scope : they only answer the precise research question.
The 7 steps for conducting a systematic review are explained with an example.
Step 1: Formulate a research question
Formulating the research question is probably the most important step of a systematic review. A clear research question will:
- Allow you to more effectively communicate your research to other researchers and practitioners
- Guide your decisions as you plan and conduct your systematic review
A good research question for a systematic review has four components, which you can remember with the acronym PICO :
- Population(s) or problem(s)
- Intervention(s)
- Comparison(s)
You can rearrange these four components to write your research question:
- What is the effectiveness of I versus C for O in P ?
Sometimes, you may want to include a fifth component, the type of study design . In this case, the acronym is PICOT .
- Type of study design(s)
- The population of patients with eczema
- The intervention of probiotics
- In comparison to no treatment, placebo , or non-probiotic treatment
- The outcome of changes in participant-, parent-, and doctor-rated symptoms of eczema and quality of life
- Randomized control trials, a type of study design
Their research question was:
- What is the effectiveness of probiotics versus no treatment, a placebo, or a non-probiotic treatment for reducing eczema symptoms and improving quality of life in patients with eczema?
Step 2: Develop a protocol
A protocol is a document that contains your research plan for the systematic review. This is an important step because having a plan allows you to work more efficiently and reduces bias.
Your protocol should include the following components:
- Background information : Provide the context of the research question, including why it’s important.
- Research objective (s) : Rephrase your research question as an objective.
- Selection criteria: State how you’ll decide which studies to include or exclude from your review.
- Search strategy: Discuss your plan for finding studies.
- Analysis: Explain what information you’ll collect from the studies and how you’ll synthesize the data.
If you’re a professional seeking to publish your review, it’s a good idea to bring together an advisory committee . This is a group of about six people who have experience in the topic you’re researching. They can help you make decisions about your protocol.
It’s highly recommended to register your protocol. Registering your protocol means submitting it to a database such as PROSPERO or ClinicalTrials.gov .
Step 3: Search for all relevant studies
Searching for relevant studies is the most time-consuming step of a systematic review.
To reduce bias, it’s important to search for relevant studies very thoroughly. Your strategy will depend on your field and your research question, but sources generally fall into these four categories:
- Databases: Search multiple databases of peer-reviewed literature, such as PubMed or Scopus . Think carefully about how to phrase your search terms and include multiple synonyms of each word. Use Boolean operators if relevant.
- Handsearching: In addition to searching the primary sources using databases, you’ll also need to search manually. One strategy is to scan relevant journals or conference proceedings. Another strategy is to scan the reference lists of relevant studies.
- Gray literature: Gray literature includes documents produced by governments, universities, and other institutions that aren’t published by traditional publishers. Graduate student theses are an important type of gray literature, which you can search using the Networked Digital Library of Theses and Dissertations (NDLTD) . In medicine, clinical trial registries are another important type of gray literature.
- Experts: Contact experts in the field to ask if they have unpublished studies that should be included in your review.
At this stage of your review, you won’t read the articles yet. Simply save any potentially relevant citations using bibliographic software, such as Scribbr’s APA or MLA Generator .
- Databases: EMBASE, PsycINFO, AMED, LILACS, and ISI Web of Science
- Handsearch: Conference proceedings and reference lists of articles
- Gray literature: The Cochrane Library, the metaRegister of Controlled Trials, and the Ongoing Skin Trials Register
- Experts: Authors of unpublished registered trials, pharmaceutical companies, and manufacturers of probiotics
Step 4: Apply the selection criteria
Applying the selection criteria is a three-person job. Two of you will independently read the studies and decide which to include in your review based on the selection criteria you established in your protocol . The third person’s job is to break any ties.
To increase inter-rater reliability , ensure that everyone thoroughly understands the selection criteria before you begin.
If you’re writing a systematic review as a student for an assignment, you might not have a team. In this case, you’ll have to apply the selection criteria on your own; you can mention this as a limitation in your paper’s discussion.
You should apply the selection criteria in two phases:
- Based on the titles and abstracts : Decide whether each article potentially meets the selection criteria based on the information provided in the abstracts.
- Based on the full texts: Download the articles that weren’t excluded during the first phase. If an article isn’t available online or through your library, you may need to contact the authors to ask for a copy. Read the articles and decide which articles meet the selection criteria.
It’s very important to keep a meticulous record of why you included or excluded each article. When the selection process is complete, you can summarize what you did using a PRISMA flow diagram .
Next, Boyle and colleagues found the full texts for each of the remaining studies. Boyle and Tang read through the articles to decide if any more studies needed to be excluded based on the selection criteria.
When Boyle and Tang disagreed about whether a study should be excluded, they discussed it with Varigos until the three researchers came to an agreement.
Step 5: Extract the data
Extracting the data means collecting information from the selected studies in a systematic way. There are two types of information you need to collect from each study:
- Information about the study’s methods and results . The exact information will depend on your research question, but it might include the year, study design , sample size, context, research findings , and conclusions. If any data are missing, you’ll need to contact the study’s authors.
- Your judgment of the quality of the evidence, including risk of bias .
You should collect this information using forms. You can find sample forms in The Registry of Methods and Tools for Evidence-Informed Decision Making and the Grading of Recommendations, Assessment, Development and Evaluations Working Group .
Extracting the data is also a three-person job. Two people should do this step independently, and the third person will resolve any disagreements.
They also collected data about possible sources of bias, such as how the study participants were randomized into the control and treatment groups.
Step 6: Synthesize the data
Synthesizing the data means bringing together the information you collected into a single, cohesive story. There are two main approaches to synthesizing the data:
- Narrative ( qualitative ): Summarize the information in words. You’ll need to discuss the studies and assess their overall quality.
- Quantitative : Use statistical methods to summarize and compare data from different studies. The most common quantitative approach is a meta-analysis , which allows you to combine results from multiple studies into a summary result.
Generally, you should use both approaches together whenever possible. If you don’t have enough data, or the data from different studies aren’t comparable, then you can take just a narrative approach. However, you should justify why a quantitative approach wasn’t possible.
Boyle and colleagues also divided the studies into subgroups, such as studies about babies, children, and adults, and analyzed the effect sizes within each group.
Step 7: Write and publish a report
The purpose of writing a systematic review article is to share the answer to your research question and explain how you arrived at this answer.
Your article should include the following sections:
- Abstract : A summary of the review
- Introduction : Including the rationale and objectives
- Methods : Including the selection criteria, search method, data extraction method, and synthesis method
- Results : Including results of the search and selection process, study characteristics, risk of bias in the studies, and synthesis results
- Discussion : Including interpretation of the results and limitations of the review
- Conclusion : The answer to your research question and implications for practice, policy, or research
To verify that your report includes everything it needs, you can use the PRISMA checklist .
Once your report is written, you can publish it in a systematic review database, such as the Cochrane Database of Systematic Reviews , and/or in a peer-reviewed journal.
In their report, Boyle and colleagues concluded that probiotics cannot be recommended for reducing eczema symptoms or improving quality of life in patients with eczema. Note Generative AI tools like ChatGPT can be useful at various stages of the writing and research process and can help you to write your systematic review. However, we strongly advise against trying to pass AI-generated text off as your own work.
If you want to know more about statistics , methodology , or research bias , make sure to check out some of our other articles with explanations and examples.
- Student’s t -distribution
- Normal distribution
- Null and Alternative Hypotheses
- Chi square tests
- Confidence interval
- Quartiles & Quantiles
- Cluster sampling
- Stratified sampling
- Data cleansing
- Reproducibility vs Replicability
- Peer review
- Prospective cohort study
Research bias
- Implicit bias
- Cognitive bias
- Placebo effect
- Hawthorne effect
- Hindsight bias
- Affect heuristic
- Social desirability bias
A literature review is a survey of scholarly sources (such as books, journal articles, and theses) related to a specific topic or research question .
It is often written as part of a thesis, dissertation , or research paper , in order to situate your work in relation to existing knowledge.
A literature review is a survey of credible sources on a topic, often used in dissertations , theses, and research papers . Literature reviews give an overview of knowledge on a subject, helping you identify relevant theories and methods, as well as gaps in existing research. Literature reviews are set up similarly to other academic texts , with an introduction , a main body, and a conclusion .
An annotated bibliography is a list of source references that has a short description (called an annotation ) for each of the sources. It is often assigned as part of the research process for a paper .
A systematic review is secondary research because it uses existing research. You don’t collect new data yourself.
Cite this Scribbr article
If you want to cite this source, you can copy and paste the citation or click the “Cite this Scribbr article” button to automatically add the citation to our free Citation Generator.
Turney, S. (2023, November 20). Systematic Review | Definition, Example & Guide. Scribbr. Retrieved July 10, 2024, from https://www.scribbr.com/methodology/systematic-review/
Is this article helpful?

Shaun Turney
Other students also liked, how to write a literature review | guide, examples, & templates, how to write a research proposal | examples & templates, what is critical thinking | definition & examples, "i thought ai proofreading was useless but..".
I've been using Scribbr for years now and I know it's a service that won't disappoint. It does a good job spotting mistakes”
Covidence website will be inaccessible as we upgrading our platform on Monday 23rd August at 10am AEST, / 2am CEST/1am BST (Sunday, 15th August 8pm EDT/5pm PDT)
The difference between a systematic review and a literature review
- Best Practice
Home | Blog | Best Practice | The difference between a systematic review and a literature review
Covidence takes a look at the difference between the two
Most of us are familiar with the terms systematic review and literature review. Both review types synthesise evidence and provide summary information. So what are the differences? What does systematic mean? And which approach is best 🤔 ?
‘ Systematic ‘ describes the review’s methods. It means that they are transparent, reproducible and defined before the search gets underway. That’s important because it helps to minimise the bias that would result from cherry-picking studies in a non-systematic way.
This brings us to literature reviews. Literature reviews don’t usually apply the same rigour in their methods. That’s because, unlike systematic reviews, they don’t aim to produce an answer to a clinical question. Literature reviews can provide context or background information for a new piece of research. They can also stand alone as a general guide to what is already known about a particular topic.
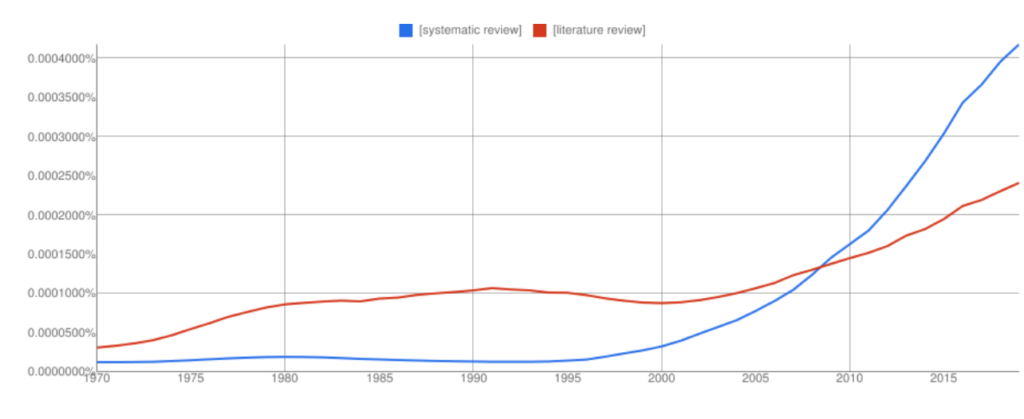
Interest in systematic reviews has grown in recent years and the frequency of ‘systematic reviews’ in Google books has overtaken ‘literature reviews’ (with all the usual Ngram Viewer warnings – it searches around 6% of all books, no journals).
Let’s take a look at the two review types in more detail to highlight some key similarities and differences 👀.
🙋🏾♂️ What is a systematic review?
Systematic reviews ask a specific question about the effectiveness of a treatment and answer it by summarising evidence that meets a set of pre-specified criteria.
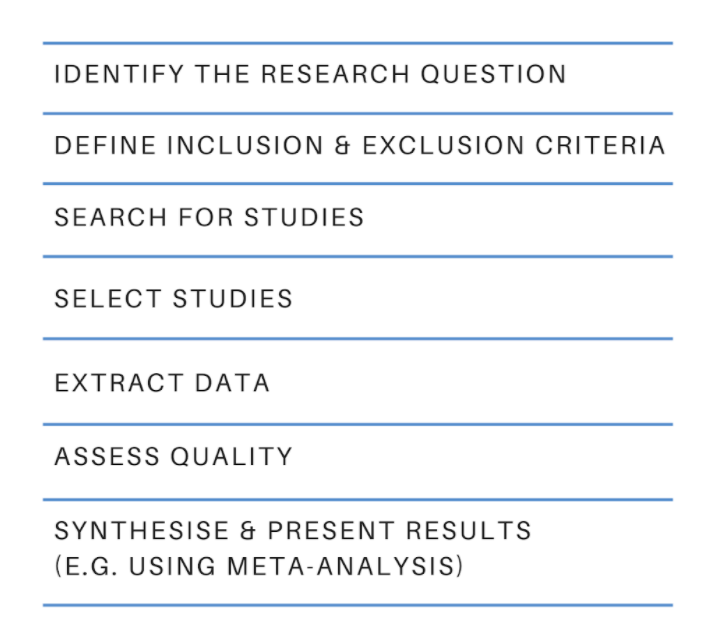
The process starts with a research question and a protocol or research plan. A review team searches for studies to answer the question using a highly sensitive search strategy. The retrieved studies are then screened for eligibility using the inclusion and exclusion criteria (this is done by at least two people working independently). Next, the reviewers extract the relevant data and assess the quality of the included studies. Finally, the review team synthesises the extracted study data and presents the results. The process is shown in figure 2 .
The results of a systematic review can be presented in many ways and the choice will depend on factors such as the type of data. Some reviews use meta-analysis to produce a statistical summary of effect estimates. Other reviews use narrative synthesis to present a textual summary.
Covidence accelerates the screening, data extraction, and quality assessment stages of your systematic review. It provides simple workflows and easy collaboration with colleagues around the world.
When is it appropriate to do a systematic review?
If you have a clinical question about the effectiveness of a particular treatment or treatments, you could answer it by conducting a systematic review. Systematic reviews in clinical medicine often follow the PICO framework, which stands for:
👦 Population (or patients)
💊 Intervention
💊 Comparison
Here’s a typical example of a systematic review title that uses the PICO framework: Alarms [intervention] versus drug treatments [comparison] for the prevention of nocturnal enuresis [outcome] in children [population]
Key attributes
- Systematic reviews follow prespecified methods
- The methods are explicit and replicable
- The review team assesses the quality of the evidence and attempts to minimise bias
- Results and conclusions are based on the evidence
🙋🏻♀️ What is a literature review?
Literature reviews provide an overview of what is known about a particular topic. They evaluate the material, rather than simply restating it, but the methods used to do this are not usually prespecified and they are not described in detail in the review. The search might be comprehensive but it does not aim to be exhaustive. Literature reviews are also referred to as narrative reviews.
Literature reviews use a topical approach and often take the form of a discussion. Precision and replicability are not the focus, rather the author seeks to demonstrate their understanding and perhaps also present their work in the context of what has come before. Often, this sort of synthesis does not attempt to control for the author’s own bias. The results or conclusion of a literature review is likely to be presented using words rather than statistical methods.
When is it appropriate to do a literature review?
We’ve all written some form of literature review: they are a central part of academic research ✍🏾. Literature reviews often form the introduction to a piece of writing, to provide the context. They can also be used to identify gaps in the literature and the need to fill them with new research 📚.
- Literature reviews take a thematic approach
- They do not specify inclusion or exclusion criteria
- They do not answer a clinical question
- The conclusions might be influenced by the author’s own views
🙋🏽 Ok, but what is a systematic literature review?
A quick internet search retrieves a cool 200 million hits for ‘systematic literature review’. What strange hybrid is this 🤯🤯 ?
Systematic review methodology has its roots in evidence-based medicine but it quickly gained traction in other areas – the social sciences for example – where researchers recognise the value of being methodical and minimising bias. Systematic review methods are increasingly applied to the more traditional types of review, including literature reviews, hence the proliferation of terms like ‘systematic literature review’ and many more.
Beware of the labels 🚨. The terminology used to describe review types can vary by discipline and changes over time. To really understand how any review was done you will need to examine the methods critically and make your own assessment of the quality and reliability of each synthesis 🤓.
Review methods are evolving constantly as researchers find new ways to meet the challenge of synthesising the evidence. Systematic review methods have influenced many other review types, including the traditional literature review.
Covidence is a web-based tool that saves you time at the screening, selection, data extraction and quality assessment stages of your systematic review. It supports easy collaboration across teams and provides a clear overview of task status.
Get a glimpse inside Covidence and how it works

Laura Mellor. Portsmouth, UK
Perhaps you'd also like....

Data Extraction Tip 5: Communicate Regularly
The Covidence Global Scholarship recipients are putting evidence-based research into practice. We caught up with some of the winners to discover the impact of their work and find out more about their experiences.

Data Extraction Tip 4: Extract the Right Amount of Data

Data Extraction Tip 3: Pilot the Template
Better systematic review management, head office, working for an institution or organisation.
Find out why over 350 of the world’s leading institutions are seeing a surge in publications since using Covidence!
Request a consultation with one of our team members and start empowering your researchers:
By using our site you consent to our use of cookies to measure and improve our site’s performance. Please see our Privacy Policy for more information.
University Libraries University of Nevada, Reno
- Skill Guides
- Subject Guides
Systematic, Scoping, and Other Literature Reviews: Overview
- Project Planning
What Is a Systematic Review?
Regular literature reviews are simply summaries of the literature on a particular topic. A systematic review, however, is a comprehensive literature review conducted to answer a specific research question. Authors of a systematic review aim to find, code, appraise, and synthesize all of the previous research on their question in an unbiased and well-documented manner. The Preferred Reporting Items for Systematic Reviews and Meta-Analyses (PRISMA) outline the minimum amount of information that needs to be reported at the conclusion of a systematic review project.
Other types of what are known as "evidence syntheses," such as scoping, rapid, and integrative reviews, have varying methodologies. While systematic reviews originated with and continue to be a popular publication type in medicine and other health sciences fields, more and more researchers in other disciplines are choosing to conduct evidence syntheses.
This guide will walk you through the major steps of a systematic review and point you to key resources including Covidence, a systematic review project management tool. For help with systematic reviews and other major literature review projects, please send us an email at [email protected] .
Getting Help with Reviews
Organization such as the Institute of Medicine recommend that you consult a librarian when conducting a systematic review. Librarians at the University of Nevada, Reno can help you:
- Understand best practices for conducting systematic reviews and other evidence syntheses in your discipline
- Choose and formulate a research question
- Decide which review type (e.g., systematic, scoping, rapid, etc.) is the best fit for your project
- Determine what to include and where to register a systematic review protocol
- Select search terms and develop a search strategy
- Identify databases and platforms to search
- Find the full text of articles and other sources
- Become familiar with free citation management (e.g., EndNote, Zotero)
- Get access to you and help using Covidence, a systematic review project management tool
Doing a Systematic Review
- Plan - This is the project planning stage. You and your team will need to develop a good research question, determine the type of review you will conduct (systematic, scoping, rapid, etc.), and establish the inclusion and exclusion criteria (e.g., you're only going to look at studies that use a certain methodology). All of this information needs to be included in your protocol. You'll also need to ensure that the project is viable - has someone already done a systematic review on this topic? Do some searches and check the various protocol registries to find out.
- Identify - Next, a comprehensive search of the literature is undertaken to ensure all studies that meet the predetermined criteria are identified. Each research question is different, so the number and types of databases you'll search - as well as other online publication venues - will vary. Some standards and guidelines specify that certain databases (e.g., MEDLINE, EMBASE) should be searched regardless. Your subject librarian can help you select appropriate databases to search and develop search strings for each of those databases.
- Evaluate - In this step, retrieved articles are screened and sorted using the predetermined inclusion and exclusion criteria. The risk of bias for each included study is also assessed around this time. It's best if you import search results into a citation management tool (see below) to clean up the citations and remove any duplicates. You can then use a tool like Rayyan (see below) to screen the results. You should begin by screening titles and abstracts only, and then you'll examine the full text of any remaining articles. Each study should be reviewed by a minimum of two people on the project team.
- Collect - Each included study is coded and the quantitative or qualitative data contained in these studies is then synthesized. You'll have to either find or develop a coding strategy or form that meets your needs.
- Explain - The synthesized results are articulated and contextualized. What do the results mean? How have they answered your research question?
- Summarize - The final report provides a complete description of the methods and results in a clear, transparent fashion.
Adapted from
Types of reviews, systematic review.
These types of studies employ a systematic method to analyze and synthesize the results of numerous studies. "Systematic" in this case means following a strict set of steps - as outlined by entities like PRISMA and the Institute of Medicine - so as to make the review more reproducible and less biased. Consistent, thorough documentation is also key. Reviews of this type are not meant to be conducted by an individual but rather a (small) team of researchers. Systematic reviews are widely used in the health sciences, often to find a generalized conclusion from multiple evidence-based studies.
Meta-Analysis
A systematic method that uses statistics to analyze the data from numerous studies. The researchers combine the data from studies with similar data types and analyze them as a single, expanded dataset. Meta-analyses are a type of systematic review.
Scoping Review
A scoping review employs the systematic review methodology to explore a broader topic or question rather than a specific and answerable one, as is generally the case with a systematic review. Authors of these types of reviews seek to collect and categorize the existing literature so as to identify any gaps.
Rapid Review
Rapid reviews are systematic reviews conducted under a time constraint. Researchers make use of workarounds to complete the review quickly (e.g., only looking at English-language publications), which can lead to a less thorough and more biased review.
Narrative Review
A traditional literature review that summarizes and synthesizes the findings of numerous original research articles. The purpose and scope of narrative literature reviews vary widely and do not follow a set protocol. Most literature reviews are narrative reviews.
Umbrella Review
Umbrella reviews are, essentially, systematic reviews of systematic reviews. These compile evidence from multiple review studies into one usable document.
Grant, Maria J., and Andrew Booth. “A Typology of Reviews: An Analysis of 14 Review Types and Associated Methodologies.” Health Information & Libraries Journal , vol. 26, no. 2, 2009, pp. 91-108. doi: 10.1111/j.1471-1842.2009.00848.x .
- Next: Project Planning >>
Penn State University Libraries
- Home-Articles and Databases
- Asking the clinical question
- PICO & Finding Evidence
- Evaluating the Evidence
- Systematic Review vs. Literature Review
- Ethical & Legal Issues for Nurses
- Nursing Library Instruction Course
- Data Management Toolkit This link opens in a new window
- Useful Nursing Resources
- Writing Resources
- LionSearch and Finding Articles
- The Catalog and Finding Books
Know the Difference! Systematic Review vs. Literature Review
It is common to confuse systematic and literature reviews as both are used to provide a summary of the existent literature or research on a specific topic. Even with this common ground, both types vary significantly. Please review the following chart (and its corresponding poster linked below) for the detailed explanation of each as well as the differences between each type of review.
| Systematic Review | Literature Review | |
|---|---|---|
| Definition | High-level overview of primary research on a focused question that identifies, selects, synthesizes, and appraises all high quality research evidence relevant to that question | Qualitatively summarizes evidence on a topic using informal or subjective methods to collect and interpret studies |
| Goals | Answers a focused clinical question Eliminate bias | Provide summary or overview of topic |
| Question | Clearly defined and answerable clinical question Recommend using PICO as a guide | Can be a general topic or a specific question |
| Components | Pre-specified eligibility criteria Systematic search strategy Assessment of the validity of findings Interpretation and presentation of results Reference list | Introduction Methods Discussion Conclusion Reference list |
| Number of Authors | Three or more | One or more |
| Timeline | Months to years Average eighteen months | Weeks to months |
| Requirement | Thorough knowledge of topic Perform searches of all relevant databases Statistical analysis resources (for meta-analysis) | Understanding of topic |
| Value | Connects practicing clinicians to high quality evidence Supports evidence-based practice | Provides summary of literature on the topic |
- What's in a name? The difference between a Systematic Review and a Literature Review, and why it matters by Lynn Kysh, MLIS, University of Southern California - Norris Medical Library
- << Previous: Evaluating the Evidence
- Next: Ethical & Legal Issues for Nurses >>
- Last Updated: Mar 1, 2024 11:54 AM
- URL: https://guides.libraries.psu.edu/nursing

An official website of the United States government
The .gov means it’s official. Federal government websites often end in .gov or .mil. Before sharing sensitive information, make sure you’re on a federal government site.
The site is secure. The https:// ensures that you are connecting to the official website and that any information you provide is encrypted and transmitted securely.
- Publications
- Account settings
Preview improvements coming to the PMC website in October 2024. Learn More or Try it out now .
- Advanced Search
- Journal List
- Korean J Anesthesiol
- v.71(2); 2018 Apr
Introduction to systematic review and meta-analysis
1 Department of Anesthesiology and Pain Medicine, Inje University Seoul Paik Hospital, Seoul, Korea
2 Department of Anesthesiology and Pain Medicine, Chung-Ang University College of Medicine, Seoul, Korea
Systematic reviews and meta-analyses present results by combining and analyzing data from different studies conducted on similar research topics. In recent years, systematic reviews and meta-analyses have been actively performed in various fields including anesthesiology. These research methods are powerful tools that can overcome the difficulties in performing large-scale randomized controlled trials. However, the inclusion of studies with any biases or improperly assessed quality of evidence in systematic reviews and meta-analyses could yield misleading results. Therefore, various guidelines have been suggested for conducting systematic reviews and meta-analyses to help standardize them and improve their quality. Nonetheless, accepting the conclusions of many studies without understanding the meta-analysis can be dangerous. Therefore, this article provides an easy introduction to clinicians on performing and understanding meta-analyses.
Introduction
A systematic review collects all possible studies related to a given topic and design, and reviews and analyzes their results [ 1 ]. During the systematic review process, the quality of studies is evaluated, and a statistical meta-analysis of the study results is conducted on the basis of their quality. A meta-analysis is a valid, objective, and scientific method of analyzing and combining different results. Usually, in order to obtain more reliable results, a meta-analysis is mainly conducted on randomized controlled trials (RCTs), which have a high level of evidence [ 2 ] ( Fig. 1 ). Since 1999, various papers have presented guidelines for reporting meta-analyses of RCTs. Following the Quality of Reporting of Meta-analyses (QUORUM) statement [ 3 ], and the appearance of registers such as Cochrane Library’s Methodology Register, a large number of systematic literature reviews have been registered. In 2009, the Preferred Reporting Items for Systematic Reviews and Meta-Analyses (PRISMA) statement [ 4 ] was published, and it greatly helped standardize and improve the quality of systematic reviews and meta-analyses [ 5 ].

Levels of evidence.
In anesthesiology, the importance of systematic reviews and meta-analyses has been highlighted, and they provide diagnostic and therapeutic value to various areas, including not only perioperative management but also intensive care and outpatient anesthesia [6–13]. Systematic reviews and meta-analyses include various topics, such as comparing various treatments of postoperative nausea and vomiting [ 14 , 15 ], comparing general anesthesia and regional anesthesia [ 16 – 18 ], comparing airway maintenance devices [ 8 , 19 ], comparing various methods of postoperative pain control (e.g., patient-controlled analgesia pumps, nerve block, or analgesics) [ 20 – 23 ], comparing the precision of various monitoring instruments [ 7 ], and meta-analysis of dose-response in various drugs [ 12 ].
Thus, literature reviews and meta-analyses are being conducted in diverse medical fields, and the aim of highlighting their importance is to help better extract accurate, good quality data from the flood of data being produced. However, a lack of understanding about systematic reviews and meta-analyses can lead to incorrect outcomes being derived from the review and analysis processes. If readers indiscriminately accept the results of the many meta-analyses that are published, incorrect data may be obtained. Therefore, in this review, we aim to describe the contents and methods used in systematic reviews and meta-analyses in a way that is easy to understand for future authors and readers of systematic review and meta-analysis.
Study Planning
It is easy to confuse systematic reviews and meta-analyses. A systematic review is an objective, reproducible method to find answers to a certain research question, by collecting all available studies related to that question and reviewing and analyzing their results. A meta-analysis differs from a systematic review in that it uses statistical methods on estimates from two or more different studies to form a pooled estimate [ 1 ]. Following a systematic review, if it is not possible to form a pooled estimate, it can be published as is without progressing to a meta-analysis; however, if it is possible to form a pooled estimate from the extracted data, a meta-analysis can be attempted. Systematic reviews and meta-analyses usually proceed according to the flowchart presented in Fig. 2 . We explain each of the stages below.

Flowchart illustrating a systematic review.
Formulating research questions
A systematic review attempts to gather all available empirical research by using clearly defined, systematic methods to obtain answers to a specific question. A meta-analysis is the statistical process of analyzing and combining results from several similar studies. Here, the definition of the word “similar” is not made clear, but when selecting a topic for the meta-analysis, it is essential to ensure that the different studies present data that can be combined. If the studies contain data on the same topic that can be combined, a meta-analysis can even be performed using data from only two studies. However, study selection via a systematic review is a precondition for performing a meta-analysis, and it is important to clearly define the Population, Intervention, Comparison, Outcomes (PICO) parameters that are central to evidence-based research. In addition, selection of the research topic is based on logical evidence, and it is important to select a topic that is familiar to readers without clearly confirmed the evidence [ 24 ].
Protocols and registration
In systematic reviews, prior registration of a detailed research plan is very important. In order to make the research process transparent, primary/secondary outcomes and methods are set in advance, and in the event of changes to the method, other researchers and readers are informed when, how, and why. Many studies are registered with an organization like PROSPERO ( http://www.crd.york.ac.uk/PROSPERO/ ), and the registration number is recorded when reporting the study, in order to share the protocol at the time of planning.
Defining inclusion and exclusion criteria
Information is included on the study design, patient characteristics, publication status (published or unpublished), language used, and research period. If there is a discrepancy between the number of patients included in the study and the number of patients included in the analysis, this needs to be clearly explained while describing the patient characteristics, to avoid confusing the reader.
Literature search and study selection
In order to secure proper basis for evidence-based research, it is essential to perform a broad search that includes as many studies as possible that meet the inclusion and exclusion criteria. Typically, the three bibliographic databases Medline, Embase, and Cochrane Central Register of Controlled Trials (CENTRAL) are used. In domestic studies, the Korean databases KoreaMed, KMBASE, and RISS4U may be included. Effort is required to identify not only published studies but also abstracts, ongoing studies, and studies awaiting publication. Among the studies retrieved in the search, the researchers remove duplicate studies, select studies that meet the inclusion/exclusion criteria based on the abstracts, and then make the final selection of studies based on their full text. In order to maintain transparency and objectivity throughout this process, study selection is conducted independently by at least two investigators. When there is a inconsistency in opinions, intervention is required via debate or by a third reviewer. The methods for this process also need to be planned in advance. It is essential to ensure the reproducibility of the literature selection process [ 25 ].
Quality of evidence
However, well planned the systematic review or meta-analysis is, if the quality of evidence in the studies is low, the quality of the meta-analysis decreases and incorrect results can be obtained [ 26 ]. Even when using randomized studies with a high quality of evidence, evaluating the quality of evidence precisely helps determine the strength of recommendations in the meta-analysis. One method of evaluating the quality of evidence in non-randomized studies is the Newcastle-Ottawa Scale, provided by the Ottawa Hospital Research Institute 1) . However, we are mostly focusing on meta-analyses that use randomized studies.
If the Grading of Recommendations, Assessment, Development and Evaluations (GRADE) system ( http://www.gradeworkinggroup.org/ ) is used, the quality of evidence is evaluated on the basis of the study limitations, inaccuracies, incompleteness of outcome data, indirectness of evidence, and risk of publication bias, and this is used to determine the strength of recommendations [ 27 ]. As shown in Table 1 , the study limitations are evaluated using the “risk of bias” method proposed by Cochrane 2) . This method classifies bias in randomized studies as “low,” “high,” or “unclear” on the basis of the presence or absence of six processes (random sequence generation, allocation concealment, blinding participants or investigators, incomplete outcome data, selective reporting, and other biases) [ 28 ].
The Cochrane Collaboration’s Tool for Assessing the Risk of Bias [ 28 ]
| Domain | Support of judgement | Review author’s judgement |
|---|---|---|
| Sequence generation | Describe the method used to generate the allocation sequence in sufficient detail to allow for an assessment of whether it should produce comparable groups. | Selection bias (biased allocation to interventions) due to inadequate generation of a randomized sequence. |
| Allocation concealment | Describe the method used to conceal the allocation sequence in sufficient detail to determine whether intervention allocations could have been foreseen in advance of, or during, enrollment. | Selection bias (biased allocation to interventions) due to inadequate concealment of allocations prior to assignment. |
| Blinding | Describe all measures used, if any, to blind study participants and personnel from knowledge of which intervention a participant received. | Performance bias due to knowledge of the allocated interventions by participants and personnel during the study. |
| Describe all measures used, if any, to blind study outcome assessors from knowledge of which intervention a participant received. | Detection bias due to knowledge of the allocated interventions by outcome assessors. | |
| Incomplete outcome data | Describe the completeness of outcome data for each main outcome, including attrition and exclusions from the analysis. State whether attrition and exclusions were reported, the numbers in each intervention group, reasons for attrition/exclusions where reported, and any re-inclusions in analyses performed by the review authors. | Attrition bias due to amount, nature, or handling of incomplete outcome data. |
| Selective reporting | State how the possibility of selective outcome reporting was examined by the review authors, and what was found. | Reporting bias due to selective outcome reporting. |
| Other bias | State any important concerns about bias not addressed in the other domains in the tool. | Bias due to problems not covered elsewhere in the table. |
| If particular questions/entries were prespecified in the reviews protocol, responses should be provided for each question/entry. |
Data extraction
Two different investigators extract data based on the objectives and form of the study; thereafter, the extracted data are reviewed. Since the size and format of each variable are different, the size and format of the outcomes are also different, and slight changes may be required when combining the data [ 29 ]. If there are differences in the size and format of the outcome variables that cause difficulties combining the data, such as the use of different evaluation instruments or different evaluation timepoints, the analysis may be limited to a systematic review. The investigators resolve differences of opinion by debate, and if they fail to reach a consensus, a third-reviewer is consulted.
Data Analysis
The aim of a meta-analysis is to derive a conclusion with increased power and accuracy than what could not be able to achieve in individual studies. Therefore, before analysis, it is crucial to evaluate the direction of effect, size of effect, homogeneity of effects among studies, and strength of evidence [ 30 ]. Thereafter, the data are reviewed qualitatively and quantitatively. If it is determined that the different research outcomes cannot be combined, all the results and characteristics of the individual studies are displayed in a table or in a descriptive form; this is referred to as a qualitative review. A meta-analysis is a quantitative review, in which the clinical effectiveness is evaluated by calculating the weighted pooled estimate for the interventions in at least two separate studies.
The pooled estimate is the outcome of the meta-analysis, and is typically explained using a forest plot ( Figs. 3 and and4). 4 ). The black squares in the forest plot are the odds ratios (ORs) and 95% confidence intervals in each study. The area of the squares represents the weight reflected in the meta-analysis. The black diamond represents the OR and 95% confidence interval calculated across all the included studies. The bold vertical line represents a lack of therapeutic effect (OR = 1); if the confidence interval includes OR = 1, it means no significant difference was found between the treatment and control groups.

Forest plot analyzed by two different models using the same data. (A) Fixed-effect model. (B) Random-effect model. The figure depicts individual trials as filled squares with the relative sample size and the solid line as the 95% confidence interval of the difference. The diamond shape indicates the pooled estimate and uncertainty for the combined effect. The vertical line indicates the treatment group shows no effect (OR = 1). Moreover, if the confidence interval includes 1, then the result shows no evidence of difference between the treatment and control groups.

Forest plot representing homogeneous data.
Dichotomous variables and continuous variables
In data analysis, outcome variables can be considered broadly in terms of dichotomous variables and continuous variables. When combining data from continuous variables, the mean difference (MD) and standardized mean difference (SMD) are used ( Table 2 ).
Summary of Meta-analysis Methods Available in RevMan [ 28 ]
| Type of data | Effect measure | Fixed-effect methods | Random-effect methods |
|---|---|---|---|
| Dichotomous | Odds ratio (OR) | Mantel-Haenszel (M-H) | Mantel-Haenszel (M-H) |
| Inverse variance (IV) | Inverse variance (IV) | ||
| Peto | |||
| Risk ratio (RR), | Mantel-Haenszel (M-H) | Mantel-Haenszel (M-H) | |
| Risk difference (RD) | Inverse variance (IV) | Inverse variance (IV) | |
| Continuous | Mean difference (MD), Standardized mean difference (SMD) | Inverse variance (IV) | Inverse variance (IV) |
The MD is the absolute difference in mean values between the groups, and the SMD is the mean difference between groups divided by the standard deviation. When results are presented in the same units, the MD can be used, but when results are presented in different units, the SMD should be used. When the MD is used, the combined units must be shown. A value of “0” for the MD or SMD indicates that the effects of the new treatment method and the existing treatment method are the same. A value lower than “0” means the new treatment method is less effective than the existing method, and a value greater than “0” means the new treatment is more effective than the existing method.
When combining data for dichotomous variables, the OR, risk ratio (RR), or risk difference (RD) can be used. The RR and RD can be used for RCTs, quasi-experimental studies, or cohort studies, and the OR can be used for other case-control studies or cross-sectional studies. However, because the OR is difficult to interpret, using the RR and RD, if possible, is recommended. If the outcome variable is a dichotomous variable, it can be presented as the number needed to treat (NNT), which is the minimum number of patients who need to be treated in the intervention group, compared to the control group, for a given event to occur in at least one patient. Based on Table 3 , in an RCT, if x is the probability of the event occurring in the control group and y is the probability of the event occurring in the intervention group, then x = c/(c + d), y = a/(a + b), and the absolute risk reduction (ARR) = x − y. NNT can be obtained as the reciprocal, 1/ARR.
Calculation of the Number Needed to Treat in the Dichotomous table
| Event occurred | Event not occurred | Sum | |
|---|---|---|---|
| Intervention | A | B | a + b |
| Control | C | D | c + d |
Fixed-effect models and random-effect models
In order to analyze effect size, two types of models can be used: a fixed-effect model or a random-effect model. A fixed-effect model assumes that the effect of treatment is the same, and that variation between results in different studies is due to random error. Thus, a fixed-effect model can be used when the studies are considered to have the same design and methodology, or when the variability in results within a study is small, and the variance is thought to be due to random error. Three common methods are used for weighted estimation in a fixed-effect model: 1) inverse variance-weighted estimation 3) , 2) Mantel-Haenszel estimation 4) , and 3) Peto estimation 5) .
A random-effect model assumes heterogeneity between the studies being combined, and these models are used when the studies are assumed different, even if a heterogeneity test does not show a significant result. Unlike a fixed-effect model, a random-effect model assumes that the size of the effect of treatment differs among studies. Thus, differences in variation among studies are thought to be due to not only random error but also between-study variability in results. Therefore, weight does not decrease greatly for studies with a small number of patients. Among methods for weighted estimation in a random-effect model, the DerSimonian and Laird method 6) is mostly used for dichotomous variables, as the simplest method, while inverse variance-weighted estimation is used for continuous variables, as with fixed-effect models. These four methods are all used in Review Manager software (The Cochrane Collaboration, UK), and are described in a study by Deeks et al. [ 31 ] ( Table 2 ). However, when the number of studies included in the analysis is less than 10, the Hartung-Knapp-Sidik-Jonkman method 7) can better reduce the risk of type 1 error than does the DerSimonian and Laird method [ 32 ].
Fig. 3 shows the results of analyzing outcome data using a fixed-effect model (A) and a random-effect model (B). As shown in Fig. 3 , while the results from large studies are weighted more heavily in the fixed-effect model, studies are given relatively similar weights irrespective of study size in the random-effect model. Although identical data were being analyzed, as shown in Fig. 3 , the significant result in the fixed-effect model was no longer significant in the random-effect model. One representative example of the small study effect in a random-effect model is the meta-analysis by Li et al. [ 33 ]. In a large-scale study, intravenous injection of magnesium was unrelated to acute myocardial infarction, but in the random-effect model, which included numerous small studies, the small study effect resulted in an association being found between intravenous injection of magnesium and myocardial infarction. This small study effect can be controlled for by using a sensitivity analysis, which is performed to examine the contribution of each of the included studies to the final meta-analysis result. In particular, when heterogeneity is suspected in the study methods or results, by changing certain data or analytical methods, this method makes it possible to verify whether the changes affect the robustness of the results, and to examine the causes of such effects [ 34 ].
Heterogeneity
Homogeneity test is a method whether the degree of heterogeneity is greater than would be expected to occur naturally when the effect size calculated from several studies is higher than the sampling error. This makes it possible to test whether the effect size calculated from several studies is the same. Three types of homogeneity tests can be used: 1) forest plot, 2) Cochrane’s Q test (chi-squared), and 3) Higgins I 2 statistics. In the forest plot, as shown in Fig. 4 , greater overlap between the confidence intervals indicates greater homogeneity. For the Q statistic, when the P value of the chi-squared test, calculated from the forest plot in Fig. 4 , is less than 0.1, it is considered to show statistical heterogeneity and a random-effect can be used. Finally, I 2 can be used [ 35 ].
I 2 , calculated as shown above, returns a value between 0 and 100%. A value less than 25% is considered to show strong homogeneity, a value of 50% is average, and a value greater than 75% indicates strong heterogeneity.
Even when the data cannot be shown to be homogeneous, a fixed-effect model can be used, ignoring the heterogeneity, and all the study results can be presented individually, without combining them. However, in many cases, a random-effect model is applied, as described above, and a subgroup analysis or meta-regression analysis is performed to explain the heterogeneity. In a subgroup analysis, the data are divided into subgroups that are expected to be homogeneous, and these subgroups are analyzed. This needs to be planned in the predetermined protocol before starting the meta-analysis. A meta-regression analysis is similar to a normal regression analysis, except that the heterogeneity between studies is modeled. This process involves performing a regression analysis of the pooled estimate for covariance at the study level, and so it is usually not considered when the number of studies is less than 10. Here, univariate and multivariate regression analyses can both be considered.
Publication bias
Publication bias is the most common type of reporting bias in meta-analyses. This refers to the distortion of meta-analysis outcomes due to the higher likelihood of publication of statistically significant studies rather than non-significant studies. In order to test the presence or absence of publication bias, first, a funnel plot can be used ( Fig. 5 ). Studies are plotted on a scatter plot with effect size on the x-axis and precision or total sample size on the y-axis. If the points form an upside-down funnel shape, with a broad base that narrows towards the top of the plot, this indicates the absence of a publication bias ( Fig. 5A ) [ 29 , 36 ]. On the other hand, if the plot shows an asymmetric shape, with no points on one side of the graph, then publication bias can be suspected ( Fig. 5B ). Second, to test publication bias statistically, Begg and Mazumdar’s rank correlation test 8) [ 37 ] or Egger’s test 9) [ 29 ] can be used. If publication bias is detected, the trim-and-fill method 10) can be used to correct the bias [ 38 ]. Fig. 6 displays results that show publication bias in Egger’s test, which has then been corrected using the trim-and-fill method using Comprehensive Meta-Analysis software (Biostat, USA).

Funnel plot showing the effect size on the x-axis and sample size on the y-axis as a scatter plot. (A) Funnel plot without publication bias. The individual plots are broader at the bottom and narrower at the top. (B) Funnel plot with publication bias. The individual plots are located asymmetrically.

Funnel plot adjusted using the trim-and-fill method. White circles: comparisons included. Black circles: inputted comparisons using the trim-and-fill method. White diamond: pooled observed log risk ratio. Black diamond: pooled inputted log risk ratio.
Result Presentation
When reporting the results of a systematic review or meta-analysis, the analytical content and methods should be described in detail. First, a flowchart is displayed with the literature search and selection process according to the inclusion/exclusion criteria. Second, a table is shown with the characteristics of the included studies. A table should also be included with information related to the quality of evidence, such as GRADE ( Table 4 ). Third, the results of data analysis are shown in a forest plot and funnel plot. Fourth, if the results use dichotomous data, the NNT values can be reported, as described above.
The GRADE Evidence Quality for Each Outcome
| Quality assessment | Number of patients | Effect | Quality | Importance | |||||||
|---|---|---|---|---|---|---|---|---|---|---|---|
| N | ROB | Inconsistency | Indirectness | Imprecision | Others | Palonosetron (%) | Ramosetron (%) | RR (CI) | |||
| PON | 6 | Serious | Serious | Not serious | Not serious | None | 81/304 (26.6) | 80/305 (26.2) | 0.92 (0.54 to 1.58) | Very low | Important |
| POV | 5 | Serious | Serious | Not serious | Not serious | None | 55/274 (20.1) | 60/275 (21.8) | 0.87 (0.48 to 1.57) | Very low | Important |
| PONV | 3 | Not serious | Serious | Not serious | Not serious | None | 108/184 (58.7) | 107/186 (57.5) | 0.92 (0.54 to 1.58) | Low | Important |
N: number of studies, ROB: risk of bias, PON: postoperative nausea, POV: postoperative vomiting, PONV: postoperative nausea and vomiting, CI: confidence interval, RR: risk ratio, AR: absolute risk.
When Review Manager software (The Cochrane Collaboration, UK) is used for the analysis, two types of P values are given. The first is the P value from the z-test, which tests the null hypothesis that the intervention has no effect. The second P value is from the chi-squared test, which tests the null hypothesis for a lack of heterogeneity. The statistical result for the intervention effect, which is generally considered the most important result in meta-analyses, is the z-test P value.
A common mistake when reporting results is, given a z-test P value greater than 0.05, to say there was “no statistical significance” or “no difference.” When evaluating statistical significance in a meta-analysis, a P value lower than 0.05 can be explained as “a significant difference in the effects of the two treatment methods.” However, the P value may appear non-significant whether or not there is a difference between the two treatment methods. In such a situation, it is better to announce “there was no strong evidence for an effect,” and to present the P value and confidence intervals. Another common mistake is to think that a smaller P value is indicative of a more significant effect. In meta-analyses of large-scale studies, the P value is more greatly affected by the number of studies and patients included, rather than by the significance of the results; therefore, care should be taken when interpreting the results of a meta-analysis.
When performing a systematic literature review or meta-analysis, if the quality of studies is not properly evaluated or if proper methodology is not strictly applied, the results can be biased and the outcomes can be incorrect. However, when systematic reviews and meta-analyses are properly implemented, they can yield powerful results that could usually only be achieved using large-scale RCTs, which are difficult to perform in individual studies. As our understanding of evidence-based medicine increases and its importance is better appreciated, the number of systematic reviews and meta-analyses will keep increasing. However, indiscriminate acceptance of the results of all these meta-analyses can be dangerous, and hence, we recommend that their results be received critically on the basis of a more accurate understanding.
1) http://www.ohri.ca .
2) http://methods.cochrane.org/bias/assessing-risk-bias-included-studies .
3) The inverse variance-weighted estimation method is useful if the number of studies is small with large sample sizes.
4) The Mantel-Haenszel estimation method is useful if the number of studies is large with small sample sizes.
5) The Peto estimation method is useful if the event rate is low or one of the two groups shows zero incidence.
6) The most popular and simplest statistical method used in Review Manager and Comprehensive Meta-analysis software.
7) Alternative random-effect model meta-analysis that has more adequate error rates than does the common DerSimonian and Laird method, especially when the number of studies is small. However, even with the Hartung-Knapp-Sidik-Jonkman method, when there are less than five studies with very unequal sizes, extra caution is needed.
8) The Begg and Mazumdar rank correlation test uses the correlation between the ranks of effect sizes and the ranks of their variances [ 37 ].
9) The degree of funnel plot asymmetry as measured by the intercept from the regression of standard normal deviates against precision [ 29 ].
10) If there are more small studies on one side, we expect the suppression of studies on the other side. Trimming yields the adjusted effect size and reduces the variance of the effects by adding the original studies back into the analysis as a mirror image of each study.
- Locations and Hours
- UCLA Library
- Research Guides
- Biomedical Library Guides
Systematic Reviews
- Types of Literature Reviews
What Makes a Systematic Review Different from Other Types of Reviews?
- Planning Your Systematic Review
- Database Searching
- Creating the Search
- Search Filters and Hedges
- Grey Literature
- Managing and Appraising Results
- Further Resources
Reproduced from Grant, M. J. and Booth, A. (2009), A typology of reviews: an analysis of 14 review types and associated methodologies. Health Information & Libraries Journal, 26: 91–108. doi:10.1111/j.1471-1842.2009.00848.x
| Aims to demonstrate writer has extensively researched literature and critically evaluated its quality. Goes beyond mere description to include degree of analysis and conceptual innovation. Typically results in hypothesis or mode | Seeks to identify most significant items in the field | No formal quality assessment. Attempts to evaluate according to contribution | Typically narrative, perhaps conceptual or chronological | Significant component: seeks to identify conceptual contribution to embody existing or derive new theory | |
| Generic term: published materials that provide examination of recent or current literature. Can cover wide range of subjects at various levels of completeness and comprehensiveness. May include research findings | May or may not include comprehensive searching | May or may not include quality assessment | Typically narrative | Analysis may be chronological, conceptual, thematic, etc. | |
| Mapping review/ systematic map | Map out and categorize existing literature from which to commission further reviews and/or primary research by identifying gaps in research literature | Completeness of searching determined by time/scope constraints | No formal quality assessment | May be graphical and tabular | Characterizes quantity and quality of literature, perhaps by study design and other key features. May identify need for primary or secondary research |
| Technique that statistically combines the results of quantitative studies to provide a more precise effect of the results | Aims for exhaustive, comprehensive searching. May use funnel plot to assess completeness | Quality assessment may determine inclusion/ exclusion and/or sensitivity analyses | Graphical and tabular with narrative commentary | Numerical analysis of measures of effect assuming absence of heterogeneity | |
| Refers to any combination of methods where one significant component is a literature review (usually systematic). Within a review context it refers to a combination of review approaches for example combining quantitative with qualitative research or outcome with process studies | Requires either very sensitive search to retrieve all studies or separately conceived quantitative and qualitative strategies | Requires either a generic appraisal instrument or separate appraisal processes with corresponding checklists | Typically both components will be presented as narrative and in tables. May also employ graphical means of integrating quantitative and qualitative studies | Analysis may characterise both literatures and look for correlations between characteristics or use gap analysis to identify aspects absent in one literature but missing in the other | |
| Generic term: summary of the [medical] literature that attempts to survey the literature and describe its characteristics | May or may not include comprehensive searching (depends whether systematic overview or not) | May or may not include quality assessment (depends whether systematic overview or not) | Synthesis depends on whether systematic or not. Typically narrative but may include tabular features | Analysis may be chronological, conceptual, thematic, etc. | |
| Method for integrating or comparing the findings from qualitative studies. It looks for ‘themes’ or ‘constructs’ that lie in or across individual qualitative studies | May employ selective or purposive sampling | Quality assessment typically used to mediate messages not for inclusion/exclusion | Qualitative, narrative synthesis | Thematic analysis, may include conceptual models | |
| Assessment of what is already known about a policy or practice issue, by using systematic review methods to search and critically appraise existing research | Completeness of searching determined by time constraints | Time-limited formal quality assessment | Typically narrative and tabular | Quantities of literature and overall quality/direction of effect of literature | |
| Preliminary assessment of potential size and scope of available research literature. Aims to identify nature and extent of research evidence (usually including ongoing research) | Completeness of searching determined by time/scope constraints. May include research in progress | No formal quality assessment | Typically tabular with some narrative commentary | Characterizes quantity and quality of literature, perhaps by study design and other key features. Attempts to specify a viable review | |
| Tend to address more current matters in contrast to other combined retrospective and current approaches. May offer new perspectives | Aims for comprehensive searching of current literature | No formal quality assessment | Typically narrative, may have tabular accompaniment | Current state of knowledge and priorities for future investigation and research | |
| Seeks to systematically search for, appraise and synthesis research evidence, often adhering to guidelines on the conduct of a review | Aims for exhaustive, comprehensive searching | Quality assessment may determine inclusion/exclusion | Typically narrative with tabular accompaniment | What is known; recommendations for practice. What remains unknown; uncertainty around findings, recommendations for future research | |
| Combines strengths of critical review with a comprehensive search process. Typically addresses broad questions to produce ‘best evidence synthesis’ | Aims for exhaustive, comprehensive searching | May or may not include quality assessment | Minimal narrative, tabular summary of studies | What is known; recommendations for practice. Limitations | |
| Attempt to include elements of systematic review process while stopping short of systematic review. Typically conducted as postgraduate student assignment | May or may not include comprehensive searching | May or may not include quality assessment | Typically narrative with tabular accompaniment | What is known; uncertainty around findings; limitations of methodology | |
| Specifically refers to review compiling evidence from multiple reviews into one accessible and usable document. Focuses on broad condition or problem for which there are competing interventions and highlights reviews that address these interventions and their results | Identification of component reviews, but no search for primary studies | Quality assessment of studies within component reviews and/or of reviews themselves | Graphical and tabular with narrative commentary | What is known; recommendations for practice. What remains unknown; recommendations for future research |
- << Previous: Home
- Next: Planning Your Systematic Review >>
- Last Updated: Apr 17, 2024 2:02 PM
- URL: https://guides.library.ucla.edu/systematicreviews
Literature Review vs Systematic Review
Literature review vs. systematic review, your librarian.

It’s common to confuse systematic and literature reviews because both are used to provide a summary of the existent literature or research on a specific topic. Regardless of this commonality, both types of review vary significantly. The following table provides a detailed explanation as well as the differences between systematic and literature reviews.
Kysh, Lynn (2013): Difference between a systematic review and a literature review. [figshare]. Available at: http://dx.doi.org/10.6084/m9.figshare.766364
Primary vs. Secondary Research

Parts of the Article

- Last Updated: Jun 3, 2024 2:30 PM
- URL: https://libguides.sjsu.edu/LitRevVSSysRev
Literature Review
- What is a Literature Review?
- What is a good literature review?
- Types of Literature Reviews
- What are the parts of a Literature Review?
- What is the difference between a Systematic Review and a Literature Review?
Systematic vs Literature
Systematic reviews and literature reviews are commonly confused. The main difference between the two is that systematic reviews answer a focused question whereas literature reviews contextualize a topic.
| Systematic Review | Literature Review |
|---|---|
Kysh, Lynn (2013): Difference between a systematic review and a literature review. Available at: https://figshare.com/articles/Difference_between_a_systematic_review_and_a_literature_review/766364
New More Help with Writing?
Visit the writing center via lamc tutoring.

Another Writing Tip!
Review not just what scholars are saying, but how are they saying it. Some questions to ask:
- How are they organizing their ideas?
- What methods have they used to study the problem?
- What theories have been used to explain, predict, or understand their research problem?
- What sources have they cited to support their conclusions?
- How have they used non-textual elements [e.g., charts, graphs, figures, etc.] to illustrate key points?
When you begin to write your literature review section, you'll be glad you dug deeper into how the research was designed and constructed because it establishes a means for developing more substantial analysis and interpretation of the research problem.
Hart, Chris. Doing a Literature Review: Releasing the Social Science Research Imagination . Thousand Oaks, CA: Sage Publications, 1998.
- << Previous: What are the parts of a Literature Review?
- Last Updated: Nov 21, 2023 12:49 PM
- URL: https://libguides.lamission.edu/c.php?g=1190903
Los Angeles Mission College. All rights reserved. - 13356 Eldridge Avenue, Sylmar, CA 91342. 818-364-7600 | LACCD.edu | ADA Compliance Questions or comments about this web site? Please leave Feedback
Educational resources and simple solutions for your research journey

Systematic Review vs. Literature Review: Some Essential Differences
Most budding researchers are confused between systematic review vs. literature review. As a PhD student or early career researcher, you must by now be well versed with the fact that literature review is the most important aspect of any scientific research, without which a study cannot be commenced. However, literature review is in itself an ‘umbrella term’, and there are several types of reviews, such as systematic literature reviews , that you may need to perform during your academic publishing journey, based upon their specific relevance to each study.
Your research goal, approach, and design will finally influence your choice of systematic review vs literature review . Apart from systematic literature review , some other common types of literature review are 1 :
- Narrative literature review – used to identify gaps in the existing knowledge base
- Scoping literature review – used to identify the scope of a particular study
- Integrative literature review – used to generate secondary data that upon integration can be used to define new frameworks and perspectives
- Theoretical literature review – used to pool all kinds of theories associated with a particular concept
The most commonly used form of review, however, is the systematic literature review . Compared to the other types of literature reviews described above, this one requires a more rigorous and well-defined approach. The systematic literature review can be divided into two main categories: meta-analysis and meta-synthesis. Meta-analysis is related to identifying patterns and relationships within the data, by using statistical procedures. Meta-synthesis on the other hand, is concerned with integrating findings of multiple qualitative research studies, not necessarily needing statistical procedures.

Table of Contents
Difference between systematic review and literature review
In spite of having this basic understanding, however, there might still be a lot of confusion when it comes to finalizing between a systematic review vs literature review of any other kind. Since these two types of reviews serve a similar purpose, they are often used interchangeably and the difference between systematic review and literature review is overlooked. In order to ease this confusion and smoothen the process of decision-making it is essential to have a closer look at a systematic review vs. literature review and the differences between them 2.3 :
| Goal | Provides answers to a focused question, most often a clinical question | Provides a general overview regarding any particular topic or concept
|
| Methodology | Pre-specified methods, may or may not include statistical analysis, but methods are usually reproducible. The results and conclusion are usually evidence-based.
| Methods are not as rigorous, do not have inclusion and exclusion criteria and may follow a thematic approach. The conclusions may be subjective and qualitative, based upon the individual author’s perspective of the data.
|
| Content
| The main components of the systematic literature review include: Prespecified criteria, search strategy, assessment of the validity of the findings, interpretation and presentation of the results, and references.
| The main components of this review include: Introduction, methods, discussion, conclusion, and references. |
| Author limit
| Three or more | One or more |
| Value | Valuable for clinicians, experts, and practitioners who are looking for evidence-based data.
| Valuable for a broader group of researchers and scientists who are looking to summarize and understand a particular topic in depth
|
Tips to keep in mind when performing a literature review
While the above illustrated similarities and differences between systematic review and literature review might be helpful as an overview, here are some additional pointers that you can keep in mind while performing a review for your research study 4 :
- Check the authenticity of the source thoroughly while using an article in your review.
- Regardless of the type of review that you intend to perform, i t is important to ensure that the landmark literature, the one that first spoke about your topic of interest, is given prominence in your review. These can be identified with a simple Google Scholar search and checking the most cited articles.
- Make sure to include all the latest literature that focuses on your research question.
- Avoid including irrelevant data by revisiting your aims, objectives, and research questions as often as possible during the review process.
- If you intend to submit your review in any peer-reviewed journal, make sure to have a defined structure based upon your selected type of review .
- If it is a systematic literature review , make sure that the research question is clear and cri sp and framed in a manner that is subjected to quantitative analysis.
- If it is a literature review of any other kind, make sure that you include enough checkpoints to minimize biases in your conclusions . You can use an integrative approach to show how different data points fit together, however, it is also essential to mention and describe data that doesn’t fit together in order to produce a balanced review. This can also help identify gaps and pave the way for designing future studies on the topic.
We hope that the above article was helpful for you in understanding the basics of literature review and to know the use of systemic review vs. literature review.
Q: When to do a systematic review?
A systematic review is conducted to synthesize and analyze existing research on a specific question. It’s valuable when a comprehensive assessment of available evidence is required to answer a well-defined research question. Systematic reviews follow a predefined protocol, rigorous methodology, and aim to minimize bias. They’re especially useful for informing evidence-based decisions in healthcare and policy-making.
Q: When to do a literature review?
A literature review surveys existing literature on a topic, providing an overview of key concepts and findings. It’s conducted when exploring a subject, identifying gaps, and contextualizing research. Literature reviews are valuable at the beginning of a study to establish the research landscape and justify the need for new research.
Q: What is the difference between a literature review and a scoping review?
A literature review summarizes existing research on a topic, while a scoping review maps the literature to identify research gaps and areas for further investigation. While both assess existing literature, a scoping review tends to have broader inclusion criteria and aims to provide an overview of the available research, helping researchers understand the breadth of a topic before narrowing down a research question.
Q: What’ is the difference between systematic Literature Review and Meta Analysis?
A systematic literature review aims to comprehensively identify, select, and analyze all relevant studies on a specific research question using a rigorous methodology. It summarizes findings qualitatively. On the other hand, a meta-analysis is a statistical technique applied within a systematic review. It involves pooling and analyzing quantitative data from multiple studies to provide a more precise estimate of an effect size. In essence, a meta-analysis is a quantitative synthesis that goes beyond the qualitative summary of a systematic literature review.
References:
- Types of Literature Review – Business Research Methodology. https://research-methodology.net/research-methodology/types-literature-review/
- Mellor, L. The difference between a systematic review and a literature review. Covidence. https://www.covidence.org/blog/the-difference-between-a-systematic-review-and-a-literature-review \
- Basu, G. SJSU Research Guides – Literature Review vs Systematic Review. https://libguides.sjsu.edu/LitRevVSSysRev/definitions
- Jansen, D., Phair, D. Writing A Literature Review: 7 Common (And Costly) Mistakes To Avoid. Grad Coach, June 2021. https://gradcoach.com/literature-review-mistakes/
R Discovery is a literature search and research reading platform that accelerates your research discovery journey by keeping you updated on the latest, most relevant scholarly content. With 250M+ research articles sourced from trusted aggregators like CrossRef, Unpaywall, PubMed, PubMed Central, Open Alex and top publishing houses like Springer Nature, JAMA, IOP, Taylor & Francis, NEJM, BMJ, Karger, SAGE, Emerald Publishing and more, R Discovery puts a world of research at your fingertips.
Try R Discovery Prime FREE for 1 week or upgrade at just US$72 a year to access premium features that let you listen to research on the go, read in your language, collaborate with peers, auto sync with reference managers, and much more. Choose a simpler, smarter way to find and read research – Download the app and start your free 7-day trial today !
Related Posts

Simple Random Sampling: Definition, Methods, and Examples

What is a Case Study in Research? Definition, Methods, and Examples
MSK Library Blog
Sharing research, resources & news.
Posts are written by library staff and reflect their personal opinions not necessarily those of MSK.

Systematic Review vs. Literature Review…What’s Best for Your Needs?
We at the MSK Library are often called upon to help our researchers with searches. Whether it’s a literature review or a systematic review depends on the needs of the patron, but what is the difference between these two and when are they needed? Both systematic and literature (or comprehensive) reviews are a gathering of available information on a certain subject. The difference comes in the depth of the research and the reporting of the conclusions. Let’s take a look.
A literature or comprehensive review brings together information on a topic in order to provide an overview of the available literature on a certain subject. Research materials are gathered through searching one or more databases and qualitatively brought together in the review. Literature reviews can be the first step in perusing a topic for a further study to get an idea of the current state of the science available but they can also be their own publication. Complete our Literature Search form if you would like us to find information on a review or other project you are working in.
Systematic reviews look at a topic more in depth using a scientific method. By looking at not only the available literature, but also theses/dissertations, abstracts/conference proceedings, and other grey literature sources, systematic reviews seek to be all-encompassing in showing results on a topic. To complete a systematic review, a team of researchers select a clinical question to be answered and specify eligibility criteria for their resources before synthesizing the information to answer their question. Multiple databases are searched in order to find every possible article on the topic. Not only are the results of the searches presented, but the search strategy, assessments and interpretations of research are also included in this form of review. Here at MSK, we use the PRISMA Statement to provide a helpful structure when working on systematic reviews. Take a look at our Systematic Review LibGuide to learn more about this investigation into the literature.
Literature Review: Know the Difference! Systematic Review vs. Literature Review
- Literature Review
- Purpose of a Literature Review
- Work in Progress
- Compiling & Writing
- Books, Articles, & Web Pages
- Types of Literature Reviews
- Departmental Differences
- Citation Styles & Plagiarism
- Know the Difference! Systematic Review vs. Literature Review
Systemic Review & Literature Review
- What's in a name? The difference between a Systematic Review and a Literature Review, and why it matters.
Evidence Pyramid
The evidence pyramid (image above) visually depicts the evidential strength of different research designs. Studies with the highest internal validity, characterized by a high degree of quantitative analysis, review, analysis, and stringent scientific methodology, are at the top of the pyramid. Observational research and expert opinion reside at the bottom of the pyramid. In evidence-based practice the systematic review is considered the highest level of information and is at the top of the pyramid. ( The pyramid was produced by HLWIKI Canada and is CC).
- << Previous: Citation Styles & Plagiarism
- Last Updated: Oct 19, 2023 12:07 PM
- URL: https://uscupstate.libguides.com/Literature_Review

Start your free trial
Arrange a trial for your organisation and discover why FSTA is the leading database for reliable research on the sciences of food and health.
REQUEST A FREE TRIAL
- Thought for Food Blog
What is the difference between a systematic review and a systematic literature review?
By Carol Hollier on 07-Jan-2020 12:42:03

For those not immersed in systematic reviews, understanding the difference between a systematic review and a systematic literature review can be confusing. It helps to realise that a “systematic review” is a clearly defined thing, but ambiguity creeps in around the phrase “systematic literature review” because people can and do use it in a variety of ways.
A systematic review is a research study of research studies. To qualify as a systematic review, a review needs to adhere to standards of transparency and reproducibility. It will use explicit methods to identify, select, appraise, and synthesise empirical results from different but similar studies. The study will be done in stages:
- In stage one, the question, which must be answerable, is framed
- Stage two is a comprehensive literature search to identify relevant studies
- In stage three the identified literature’s quality is scrutinised and decisions made on whether or not to include each article in the review
- In stage four the evidence is summarised and, if the review includes a meta-analysis, the data extracted; in the final stage, findings are interpreted. [1]
Some reviews also state what degree of confidence can be placed on that answer, using the GRADE scale. By going through these steps, a systematic review provides a broad evidence base on which to make decisions about medical interventions, regulatory policy, safety, or whatever question is analysed. By documenting each step explicitly, the review is not only reproducible, but can be updated as more evidence on the question is generated.
Sometimes when people talk about a “systematic literature review”, they are using the phrase interchangeably with “systematic review”. However, people can also use the phrase systematic literature review to refer to a literature review that is done in a fairly systematic way, but without the full rigor of a systematic review.
For instance, for a systematic review, reviewers would strive to locate relevant unpublished studies in grey literature and possibly by contacting researchers directly. Doing this is important for combatting publication bias, which is the tendency for studies with positive results to be published at a higher rate than studies with null results. It is easy to understand how this well-documented tendency can skew a review’s findings, but someone conducting a systematic literature review in the loose sense of the phrase might, for lack of resource or capacity, forgo that step.
Another difference might be in who is doing the research for the review. A systematic review is generally conducted by a team including an information professional for searches and a statistician for meta-analysis, along with subject experts. Team members independently evaluate the studies being considered for inclusion in the review and compare results, adjudicating any differences of opinion. In contrast, a systematic literature review might be conducted by one person.
Overall, while a systematic review must comply with set standards, you would expect any review called a systematic literature review to strive to be quite comprehensive. A systematic literature review would contrast with what is sometimes called a narrative or journalistic literature review, where the reviewer’s search strategy is not made explicit, and evidence may be cherry-picked to support an argument.
FSTA is a key tool for systematic reviews and systematic literature reviews in the sciences of food and health.

The patents indexed help find results of research not otherwise publicly available because it has been done for commercial purposes.
The FSTA thesaurus will surface results that would be missed with keyword searching alone. Since the thesaurus is designed for the sciences of food and health, it is the most comprehensive for the field.
All indexing and abstracting in FSTA is in English, so you can do your searching in English yet pick up non-English language results, and get those results translated if they meet the criteria for inclusion in a systematic review.
FSTA includes grey literature (conference proceedings) which can be difficult to find, but is important to include in comprehensive searches.
FSTA content has a deep archive. It goes back to 1969 for farm to fork research, and back to the late 1990s for food-related human nutrition literature—systematic reviews (and any literature review) should include not just the latest research but all relevant research on a question.
You can also use FSTA to find literature reviews.
FSTA allows you to easily search for review articles (both narrative and systematic reviews) by using the subject heading or thesaurus term “REVIEWS" and an appropriate free-text keyword.
On the Web of Science or EBSCO platform, an FSTA search for reviews about cassava would look like this: DE "REVIEWS" AND cassava.
On the Ovid platform using the multi-field search option, the search would look like this: reviews.sh. AND cassava.af.
In 2011 FSTA introduced the descriptor META-ANALYSIS, making it easy to search specifically for systematic reviews that include a meta-analysis published from that year onwards.
On the EBSCO or Web of Science platform, an FSTA search for systematic reviews with meta-analyses about staphylococcus aureus would look like this: DE "META-ANALYSIS" AND staphylococcus aureus.
On the Ovid platform using the multi-field search option, the search would look like this: meta-analysis.sh. AND staphylococcus aureus.af.
Systematic reviews with meta-analyses published before 2011 are included in the REVIEWS controlled vocabulary term in the thesaurus.
An easy way to locate pre-2011 systematic reviews with meta-analyses is to search the subject heading or thesaurus term "REVIEWS" AND meta-analysis as a free-text keyword AND another appropriate free-text keyword.
On the Web of Science or EBSCO platform, the FSTA search would look like this: DE "REVIEWS" AND meta-analysis AND carbohydrate*
On the Ovid platform using the multi-field search option, the search would look like this: reviews .s h. AND meta-analysis.af. AND carbohydrate*.af.
Related resources:
- Literature Searching Best Practise Guide
- Predatory publishing: Investigating researchers’ knowledge & attitudes
- The IFIS Expert Guide to Journal Publishing
Library image by Paul Schafer , microscope image by Matthew Waring , via Unsplash.

- FSTA - Food Science & Technology Abstracts
- IFIS Collections
- Resources Hub
- Diversity Statement
- Sustainability Commitment
- Company news
- Frequently Asked Questions
- Privacy Policy
- Terms of Use for IFIS Collections
Ground Floor, 115 Wharfedale Road, Winnersh Triangle, Wokingham, Berkshire RG41 5RB
Get in touch with IFIS
© International Food Information Service (IFIS Publishing) operating as IFIS – All Rights Reserved | Charity Reg. No. 1068176 | Limited Company No. 3507902 | Designed by Blend
- Our story /
- Teaching & learning /
- The city of Liverpool /
- International university /
- Widening participation
- Campus & facilities
- Our organisation
University Library
- University of Liverpool Library
- Library Help
Q. What is the difference between a systematic review and a systematic literature review?
- 26 About the Library
- 9 Accessibility
- 19 Borrow, renew, return
- 1 Collection Management
- 29 Computers and IT
- 28 Copyright
- 37 Databases
- 11 Disability Support
- 7 Dissertations & Theses
- 14 Electronic resources
- 48 Find Things
- 25 General services
- 35 Help & Support
- 2 Inter-Library Loans
- 13 Journals
- 6 Library facilities
- 7 Library Membership
- 9 Management School
- 3 Newspapers
- 26 Off-Campus
- 79 Online Resources
- 4 Open Access
- 34 Reading Lists
- 40 Referencing
- 5 Registration
- 11 Repository
- 17 Research Support
- 2 Reservations
- 2 Science Fiction
- 11 Search Tools
- 6 Special Collections & Archives
- 3 Standards & Patents
- 16 Student Support
- 7 Study Rooms
- 48 Using the Library
- 11 Visitors
Answered By: Anna Stebbing Last Updated: Feb 09, 2024 Views: 10093
DISCOVER and the Library Catalogue have been replaced by Library Search . We're busy updating all of our links, but in the meantime, please use Library Search when searching for resources or managing your Library Account.
‘Systematic’ describes the review’s methods. It means that they are transparent, reproducible and defined before the search gets underway. That’s important because it helps to minimise the bias that would result from cherry-picking studies in a non-systematic way.
Literature reviews don’t usually apply the same rigour in their methods. That’s because, unlike systematic reviews, they don’t aim to produce an answer to a clinical question. Literature reviews can provide context or background information for a new piece of research. They can also stand alone as a general guide to what is already known about a particular topic.
Summary adapted from: Mellor, L. (2022) ‘The difference between a systematic review and a literature review’, https://www.covidence.org/ , no date. Available at: https://www.covidence.org/blog/the-difference-between-a-systematic-review-and-a-literature-review/ (Accessed: 23 May 2022).
Your supervisor may ask you to do a systematic review, when what they actually want you to do is a systematic review of the literature. There are a few key differences:
| Systematic review | Systematic review |
|---|---|
| Brings together the results of studies to answer a specific question | Provides a subjective summary of the literature on a topic |
| Extensive search covering published and grey literature | Thorough search of published literature |
| Involves a detailed protocol often developed using the | Includes a detailed search strategy |
| Usually involves three or more people to eliminate bias | Can be produced by a single person, so open to bias |
| Can take months or years to produce | Weeks or months to produce |
| Includes... | Includes... |
Summary adapted from: Kysh, L. (2013) ‘What's in a name? The difference between a systematic review and a literature review and why it matters’, https://figshare.com/ , 8 August. Available at: https://figshare.com/articles/Difference_between_a_systematic_review_and_a_literature_review/766364
(Accessed: 23 May 2022).
You can find supporting online resources including videos on title Doing a Systematic Review, 2nd edition available as an ebook and as print copies in the library .
Your Liaison Librarian can also provide further help and advice.
Links & Files
- What is a literature review and how do I conduct one?
- Share on Facebook
Was this helpful? Submit a comment below to provide feedback. Yes 2 No 0
Comments (0)
Related questions, browse topics.
- About the Library
- Accessibility
- Borrow, renew, return
- Collection Management
- Computers and IT
- Disability Support
- Dissertations & Theses
- Electronic resources
- Find Things
- General services
- Help & Support
- Inter-Library Loans
- Library facilities
- Library Membership
- Management School
- Online Resources
- Open Access
- Reading Lists
- Referencing
- Registration
- Research Support
- Reservations
- Science Fiction
- Search Tools
- Special Collections & Archives
- Standards & Patents
- Student Support
- Study Rooms
- Using the Library
- Library Website Accessibility Statement
- Customer Charter
- Library Regulations
- Acceptable use of e-Resources
- Service Standards
- Re-use of Public Sector Information
- Victoria Gallery & Museum
- Garstang Museum
- Libraries, Museums and Galleries - Intranet
Home » Education » Difference Between Literature Review and Systematic Review
Difference Between Literature Review and Systematic Review
Main difference – literature review vs systematic review.
Literature review and systematic review are two scholarly texts that help to introduce new knowledge to various fields. A literature review, which reviews the existing research and information on a selected study area, is a crucial element of a research study. A systematic review is also a type of a literature review. The main difference between literature review and systematic review is their focus on the research question ; a systematic review is focused on a specific research question whereas a literature review is not.
This article highlights,
1. What is a Literature Review? – Definition, Features, Characteristics
2. What is a Systematic Review? – Definition, Features, Characteristics

What is a Literature Review
A literature review is an indispensable element of a research study. This is where the researcher shows his knowledge on the subject area he or she is researching on. A literature review is a discussion on the already existing material in the subject area. Thus, this will require a collection of published (in print or online) work concerning the selected research area. In simple terms, a literature is a review of the literature in the related subject area.
A good literature review is a critical discussion, displaying the writer’s knowledge on relevant theories and approaches and awareness of contrasting arguments. A literature review should have the following features (Caulley, 1992)
- Compare and contrast different researchers’ views
- Identify areas in which researchers are in disagreement
- Group researchers who have similar conclusions
- Criticize the methodology
- Highlight exemplary studies
- Highlight gaps in research
- Indicate the connection between your study and previous studies
- Indicate how your study will contribute to the literature in general
- Conclude by summarizing what the literature indicates
The structure of a literature review is similar to that of an article or essay, unlike an annotated bibliography . The information that is collected is integrated into paragraphs based on their relevance. Literature reviews help researchers to evaluate the existing literature, to identify a gap in the research area, to place their study in the existing research and identify future research.

What is a Systematic Review
A systematic review is a type of systematic review that is focused on a particular research question . The main purpose of this type of research is to identify, review, and summarize the best available research on a specific research question. Systematic reviews are used mainly because the review of existing studies is often more convenient than conducting a new study. These are mostly used in the health and medical field, but they are not rare in fields such as social sciences and environmental science. Given below are the main stages of a systematic review:
- Defining the research question and identifying an objective method
- Searching for relevant data that from existing research studies that meet certain criteria (research studies must be reliable and valid).
- Extracting data from the selected studies (data such as the participants, methods, outcomes, etc.
- Assessing the quality of information
- Analyzing and combining all the data which would give an overall result.
Literature Review is a critical evaluation of the existing published work in a selected research area.
Systematic Review is a type of literature review that is focused on a particular research question.
Literature Review aims to review the existing literature, identify the research gap, place the research study in relation to other studies, to evaluate promising research methods, and to suggest further research.
Systematic Review aims to identify, review, and summarize the best available research on a specific research question.
Research Question
In Literature Review, a r esearch question is formed after writing the literature review and identifying the research gap.
In Systematic Review, a research question is formed at the beginning of the systematic review.
Research Study
Literature Review is an essential component of a research study and is done at the beginning of the study.
Systematic Review is not followed by a separate research study.
Caulley, D. N. “Writing a critical review of the literature.” La Trobe University: Bundoora (1992).
“Animated Storyboard: What Are Systematic Reviews?” . cccrg.cochrane.org . Cochrane Consumers and Communication . Retrieved 1 June 2016.
Image Courtesy: Pixabay

About the Author: Hasa
Hasanthi is a seasoned content writer and editor with over 8 years of experience. Armed with a BA degree in English and a knack for digital marketing, she explores her passions for literature, history, culture, and food through her engaging and informative writing.
You May Also Like These
Leave a reply cancel reply.
5 differences between a systematic review and other types of literature review
September 26, 2017.

There are many types of reviews of the medical and public health evidence, each with its own benefits and challenges. In this blog post, we detail five key differences between a systematic review and other types of reviews, including narrative and comprehensive reviews.
First, we must define some terms. “Literature review” is a general term that describes a summary of the evidence on a certain topic. Literature reviews can be very simple or highly complex, and they can use a variety of methods for finding, assessing, and presenting evidence. A “systematic review” is a specific type of review that uses rigorous and transparent methods in an effort to summarize all of the available evidence with little to no bias. A good systematic review adheres to the international standards set forth in the Preferred Reporting Items for Systematic Reviews and Meta-Analyses (PRISMA) 27-item checklist. 1 Reviews that are less rigorous are often called “narrative,” “comprehensive,” or simply “literature reviews.”
So, what are the 5 key differences between a systematic review and other types of review?
1. The goal of the review The goal of a literature review can be broad and descriptive (example: “ Describe the available treatments for sleep apnea ”) or it can be to answer a specific question (example: “ What is the efficacy of CPAP for people with sleep apnea? ”). The goal of a systematic review is to answer a specific and focused question (example: “ Which treatment for sleep apnea reduces the apnea-hypopnea index more: CPAP or mandibular advancement device? ”). People seeking to make evidence-based decisions look to systematic reviews due to their completeness and reduced risk of bias.
2. Searching for evidence Where and how one searches for evidence is an important difference. While literature reviews require only one database or source, systematic reviews require more comprehensive efforts to locate evidence. Multiple databases are searched, each with a specifically tailored search strategy (usually designed and implemented by a specialist librarian). In addition, systematic reviews often include attempts to find data beyond typical databases. Systematic reviewers might search conference abstracts or the web sites of professional associations or pharmaceutical companies, and they may contact study authors to obtain additional or unpublished data. All of these extra steps reflect an attempt to minimize bias in the summary of the evidence. 3. Assessing search results In a systematic review, the parameters for inclusion are established at the start of the project and applied consistently to search results. Usually, such parameters take the form of PICOs (population, intervention, comparison, outcomes). Reviewers hold search results against strict criteria based on the PICOs to determine appropriateness for inclusion. Another key component of a systematic review is dual independent review of search results; each search result is reviewed by at least two people independently. In many other literature reviews, there is only a single reviewer. This can result in bias (even if it is unintentional) and missed studies.
4. Summary of findings In a systematic review, an effort is usually made to assess the quality of the evidence, often using risk of bias assessment, at the study level and often across studies. Other literature reviews rarely assess and report any formal quality assessment by individual study. Risk of bias assessment is important to a thorough summary of the evidence, since conclusions based on biased results can be incorrect (and dangerous, at worst). Results from a systematic review can sometimes be pooled quantitatively (e.g., in a meta-analysis) to provide numeric estimates of treatment effects, for example.
5. Utility of results Due to the rigor and transparency applied to a systematic review, it is not surprising that the results are usually of higher quality and at lower risk of bias than results from other types of literature review. Literature reviews can be useful to inform background sections of papers and reports and to give the reader an overview of a topic. Systematic reviews are used by professional associations and government agencies to issue guidelines and recommendations; such important activities are rarely based on a non-systematic review. Clinicians may also rely on high quality systematic reviews to make evidence-based decisions about patient care.
Each type of review has a place in the scientific literature. For narrow, specific research questions, a systematic review can provide a thorough summary and assessment of all of the available evidence. For broader research questions, other types of literature review can summarize the best available evidence using targeted search strategies. Ultimately, the choice of methodology depends on the research question and the goal of the review.
[1] Moher D, Liberati A, Tetzlaff J, Altman DG, The PRISMA Group (2009). Preferred Reporting Items for Systematic Reviews and Meta-Analyse s: The PRISMA Statement. PLoS Med 6(7): e1000097. doi:10.1371/journal.pmed1000097.
- En español – ExME
- Em português – EME
Systematic reviews vs meta-analysis: what’s the difference?
Posted on 24th July 2023 by Verónica Tanco Tellechea

You may hear the terms ‘systematic review’ and ‘meta-analysis being used interchangeably’. Although they are related, they are distinctly different. Learn more in this blog for beginners.
What is a systematic review?
According to Cochrane (1), a systematic review attempts to identify, appraise and synthesize all the empirical evidence to answer a specific research question. Thus, a systematic review is where you might find the most relevant, adequate, and current information regarding a specific topic. In the levels of evidence pyramid , systematic reviews are only surpassed by meta-analyses.
To conduct a systematic review, you will need, among other things:
- A specific research question, usually in the form of a PICO question.
- Pre-specified eligibility criteria, to decide which articles will be included or discarded from the review.
- To follow a systematic method that will minimize bias.
You can find protocols that will guide you from both Cochrane and the Equator Network , among other places, and if you are a beginner to the topic then have a read of an overview about systematic reviews.
What is a meta-analysis?
A meta-analysis is a quantitative, epidemiological study design used to systematically assess the results of previous research (2) . Usually, they are based on randomized controlled trials, though not always. This means that a meta-analysis is a mathematical tool that allows researchers to mathematically combine outcomes from multiple studies.
When can a meta-analysis be implemented?
There is always the possibility of conducting a meta-analysis, yet, for it to throw the best possible results it should be performed when the studies included in the systematic review are of good quality, similar designs, and have similar outcome measures.
Why are meta-analyses important?
Outcomes from a meta-analysis may provide more precise information regarding the estimate of the effect of what is being studied because it merges outcomes from multiple studies. In a meta-analysis, data from various trials are combined and generate an average result (1), which is portrayed in a forest plot diagram. Moreover, meta-analysis also include a funnel plot diagram to visually detect publication bias.
Conclusions
A systematic review is an article that synthesizes available evidence on a certain topic utilizing a specific research question, pre-specified eligibility criteria for including articles, and a systematic method for its production. Whereas a meta-analysis is a quantitative, epidemiological study design used to assess the results of articles included in a systematic-review.
| DEFINITION | Synthesis of empirical evidence regarding a specific research question | Statistical tool used with quantitative outcomes of various studies regarding a specific topic |
| RESULTS | Synthesizes relevant and current information regarding a specific research question (qualitative). | Merges multiple outcomes from different researches and provides an average result (quantitative). |
Remember: All meta-analyses involve a systematic review, but not all systematic reviews involve a meta-analysis.
If you would like some further reading on this topic, we suggest the following:
The systematic review – a S4BE blog article
Meta-analysis: what, why, and how – a S4BE blog article
The difference between a systematic review and a meta-analysis – a blog article via Covidence
Systematic review vs meta-analysis: what’s the difference? A 5-minute video from Research Masterminds:
- About Cochrane reviews [Internet]. Cochranelibrary.com. [cited 2023 Apr 30]. Available from: https://www.cochranelibrary.com/about/about-cochrane-reviews
- Haidich AB. Meta-analysis in medical research. Hippokratia. 2010;14(Suppl 1):29–37.

Verónica Tanco Tellechea
Leave a reply cancel reply.
Your email address will not be published. Required fields are marked *
Save my name, email, and website in this browser for the next time I comment.
Subscribe to our newsletter
You will receive our monthly newsletter and free access to Trip Premium.
Related Articles

How to read a funnel plot
This blog introduces you to funnel plots, guiding you through how to read them and what may cause them to look asymmetrical.

Heterogeneity in meta-analysis
When you bring studies together in a meta-analysis, one of the things you need to consider is the variability in your studies – this is called heterogeneity. This blog presents the three types of heterogeneity, considers the different types of outcome data, and delves a little more into dealing with the variations.

Natural killer cells in glioblastoma therapy
As seen in a previous blog from Davide, modern neuroscience often interfaces with other medical specialities. In this blog, he provides a summary of new evidence about the potential of a therapeutic strategy born at the crossroad between neurology, immunology and oncology.
About Systematic Reviews
The Difference Between Narrative Review and Systematic Review
Automate every stage of your literature review to produce evidence-based research faster and more accurately.
Reviews in scientific research are tools that help synthesize literature on a topic of interest and describe its current state. Different types of reviews are conducted depending on the research question and the scope of the review. A systematic review is one such review that is robust, reproducible, and transparent. It involves collating evidence by using all of the eligible and critically appraised literature available on a certain topic. To know more about how to do a systematic review , you can check out our article at the link. The primary aim of a systematic review is to recommend best practices and inform policy development. Hence, there is a need for high-quality, focused, and precise methods and reporting. For more exploratory research questions, methods such as a scoping review are employed. Be sure you understand the difference between a systematic review and a scoping review , if you don’t, check out the link to learn more.
When the word “review” alone is used to describe a research paper, the first thing that should come to mind is that it is a literature review. Almost every researcher starts off their career with literature reviews. To know the difference between a systematic review and a literature review , read on here. Traditional literature reviews are also sometimes referred to as narrative reviews since they use narrative analysis to synthesize data. In this article, we will explore the differences between a systematic review and a narrative review, in further detail.
Learn More About DistillerSR
(Article continues below)
Narrative Review vs Systematic Review
Both systematic and narrative reviews are classified as secondary research studies since they both use existing primary research studies e.g. case studies. Despite this similarity, there are key differences in their methodology and scope. The major differences between them lie in their objectives, methodology, and application areas.
Differences In Objective
The main objective of a systematic review is to formulate a well-defined research question and use qualitative and quantitative methods to analyze all the available evidence attempting to answer the question. In contrast, narrative reviews can address one or more questions with a much broader scope. The efficacy of narrative reviews is irreplaceable in tracking the development of a scientific principle, or a clinical concept. This ability to conduct a wider exploration could be lost in the restrictive framework of a systematic review.
Differences in Methodology
For systematic reviews, there are guidelines provided by the Cochrane Handbook, ROSES, and the PRISMA statement that can help determine the protocol, and methodology to be used. However, for narrative reviews, such standard guidelines do not exist. Although, there are recommendations available.
Systematic reviews comprise an explicit, transparent, and pre-specified methodology. The methodology followed in a systematic review is as follows,
- Formulating the clinical research question to answer (PICO approach)
- Developing a protocol (with strict inclusion and exclusion criteria for the selection of primary studies)
- Performing a detailed and broad literature search
- Critical appraisal of the selected studies
- Data extraction from the primary studies included in the review
- Data synthesis and analysis using qualitative or quantitative methods [3].
- Reporting and discussing results of data synthesis.
- Developing conclusions based on the findings.
A narrative review on the other hand does not have a strict protocol to be followed. The design of the review depends on its author and the objectives of the review. As yet, there is no consensus on the standard structure of a narrative review. The preferred approach is the IMRAD (Introduction, Methods, Results, and Discussion) [2]. Apart from the author’s preferences, a narrative review structure must respect the journal style and conventions followed in the respective field.
Differences in Application areas
Narrative reviews are aimed at identifying and summarizing what has previously been published. Their general applications include exploring existing debates, the appraisal of previous studies conducted on a certain topic, identifying knowledge gaps, and speculating on the latest interventions available. They are also used to track and report on changes that have occurred in an existing field of research. The main purpose is to deepen the understanding in a certain research area. The results of a systematic review provide the most valid evidence to guide clinical decision-making and inform policy development [1]. They have now become the gold standard in evidence-based medicine [1].
Although both types of reviews come with their own benefits and limitations, researchers should carefully consider the differences between them before making a decision on which review type to use.
- Aromataris E, Pearson A. The systematic review: an overview. AJN. Am J Nurs. 2014;114(3):53–8.
- Green BN, Johnson CD, Adams A. Writing narrative literature reviews for peer-reviewed journals: secrets of the trade. J Chiropratic Medicine 2006;5:101–117.
- Linares-Espinós E, Hernández V, Domínguez-Escrig JL, Fernández-Pello S, Hevia V, Mayor J, et al. Metodología de una revisión sistemática. Actas Urol Esp. 2018;42:499–506.
3 Reasons to Connect


Shopping Cart
No products in the cart.
Three Things To Know About Systematic Reviews
If you work on a systematic review team or plan to, you’ll want to know three important things: the essential features of a systematic review (SR), how SRs differ from other review types, and how to determine if an SR on a topic is needed.
If you work on a systematic review team or plan to, you’ll want to know three important things: the essential features and purpose of a systematic review, how systematic reviews differ from scoping reviews, rapid reviews, informal reviews and other review types, and how to determine if a systematic review on a topic is needed.
This basic knowledge is key to your success as a review team member and consultant. Subject matter experts, medical staff and statisticians eager to contribute a systematic review to the scholarly literature probably don’t know them. Your knowledge of them can save a team time and embarrassment and give you increased stature and authority.
Julie Glanville, a co-instructor on one of MLA’s most popular advanced searching courses and recognized expert on systematic review searching methods, will be your guide to learning:
- the key features of the systematic review method and the research questions systematic reviews are best able to answer
- how to efficiently locate published systematic reviews on a topic
- how to evaluate the quality of a review to determine if a new and better one is needed
When you register for the webinar, you’ll have access to brief readings and questions that will be discussed in the webinar. During the webinar, you’ll learn from presentations and discussions.
You’ll leave with new skills and knowledge that will help you raise your profile in your institution, advance in your career, and increase the satisfaction and confidence that comes from knowing you are good at what you do!
This course is an approved elective for Level I of the Systematic Review Searching Specialization .
Learning Outcomes
By the end of this webinar, you will be able to:
- Describe the essential features and purpose of a systematic review
- Explain what distinguishes systematic reviews from other review types
- Locate existing reviews
- List the key checklists for appraising the quality of systematic reviews, which can help you to determine whether a review is fit for your needs or whether a new systematic review is required
Health sciences librarians and other health information professionals who consult with researchers on reviews, who are on review teams, or plan to work with researchers.

Julie Glanville, MCLIP , is a UK-based independent information consultant focusing on consultation, training, and research in information retrieval and strategy design and a co-manager of the SuRe Info resource and the ISSG Search Filters Resource. Julie is an experienced trainer on systematic review information retrieval topics, and she has offered MLA courses for many years. Julie is also a researcher with many publications on systematic review methods, a co-author of the Cochrane Handbook chapter on searching for studies, and a contributor to systematic review guidance for several organizations, including the UK Centre for Reviews and Dissemination and the European Food Safety Authority.
MLA CE Credits : 1.5
Course Content

Course Includes
- Course Certificate
Email Address
Remember Me
Registration confirmation will be emailed to you.
- Search Menu
- Sign in through your institution
- Advance Articles
- Editor's Choice
- Collections
- Supplements
- InSight Papers
- BSR Registers Papers
- Virtual Roundtables
- Author Guidelines
- Submission Site
- Open Access Options
- Self-Archiving Policy
- About Rheumatology
- About the British Society for Rheumatology
- Editorial Board
- Advertising and Corporate Services
- Journals Career Network
- Dispatch Dates
- Terms and Conditions
- Journals on Oxford Academic
- Books on Oxford Academic

Article Contents
Introduction, supplementary material, data availability, acknowledgements.
- < Previous
Comparative efficacy and safety of bimekizumab in psoriatic arthritis: a systematic literature review and network meta-analysis
- Article contents
- Figures & tables
- Supplementary Data
Philip J Mease, Dafna D Gladman, Joseph F Merola, Peter Nash, Stacy Grieve, Victor Laliman-Khara, Damon Willems, Vanessa Taieb, Adam R Prickett, Laura C Coates, Comparative efficacy and safety of bimekizumab in psoriatic arthritis: a systematic literature review and network meta-analysis, Rheumatology , Volume 63, Issue 7, July 2024, Pages 1779–1789, https://doi.org/10.1093/rheumatology/kead705
- Permissions Icon Permissions
To understand the relative efficacy and safety of bimekizumab, a selective inhibitor of IL-17F in addition to IL-17A, vs other biologic and targeted synthetic DMARDs (b/tsDMARDs) for PsA using network meta-analysis (NMA).
A systematic literature review (most recent update conducted on 1 January 2023) identified randomized controlled trials (RCTs) of b/tsDMARDs in PsA. Bayesian NMAs were conducted for efficacy outcomes at Weeks 12–24 for b/tsDMARD-naïve and TNF inhibitor (TNFi)-experienced patients. Safety at Weeks 12–24 was analysed in a mixed population. Odds ratios (ORs) and differences of mean change with the associated 95% credible interval (CrI) were calculated for the best-fitting models, and the surface under the cumulative ranking curve (SUCRA) values were calculated to determine relative rank.
The NMA included 41 RCTs for 22 b/tsDMARDs. For minimal disease activity (MDA), bimekizumab ranked 1st in b/tsDMARD-naïve patients and 2nd in TNFi-experienced patients. In b/tsDMARD-naïve patients, bimekizumab ranked 6th, 5th and 3rd for ACR response ACR20/50/70, respectively. In TNFi-experienced patients, bimekizumab ranked 1st, 2nd and 1st for ACR20/50/70, respectively. For Psoriasis Area and Severity Index 90/100, bimekizumab ranked 2nd and 1st in b/tsDMARD-naïve patients, respectively, and 1st and 2nd in TNFi-experienced patients, respectively. Bimekizumab was comparable to b/tsDMARDs for serious adverse events.
Bimekizumab ranked favourably among b/tsDMARDs for efficacy on joint, skin and MDA outcomes, and showed comparable safety, suggesting it may be a beneficial treatment option for patients with PsA.
For joint efficacy, bimekizumab ranked highly among approved biologic/targeted synthetic DMARDs (b/tsDMARDs).
Bimekizumab provides better skin efficacy (Psoriasis Area and Severity Index, PASI100 and PASI90) than many other available treatments in PsA.
For minimal disease activity, bimekizumab ranked highest of all available b/tsDMARDs in b/tsDMARD-naïve and TNF inhibitor–experienced patients.
PsA is a chronic, systemic, inflammatory disease in which patients experience a high burden of illness [ 1–3 ]. PsA has multiple articular and extra-articular disease manifestations including peripheral arthritis, axial disease, enthesitis, dactylitis, skin psoriasis (PSO) and psoriatic nail disease [ 4 , 5 ]. Patients with PsA can also suffer from related inflammatory conditions, uveitis and IBD [ 4 , 5 ]. Approximately one fifth of all PSO patients, increasing to one quarter of patients with moderate to severe PSO, will develop PsA over time [ 6 , 7 ].
The goal of treatment is to control inflammation and prevent structural damage to minimize disease burden, normalize function and social participation, and maximize the quality of life of patients [ 1 , 4 ]. As PsA is a heterogeneous disease, the choice of treatment is guided by individual patient characteristics, efficacy against the broad spectrum of skin and joint symptoms, and varying contraindications to treatments [ 1 , 4 ]. There are a number of current treatments classed as conventional DMARDs such as MTX, SSZ, LEF; biologic (b) DMARDs such as TNF inhibitors (TNFi), IL inhibitors and cytotoxic T lymphocyte antigen 4 (CTLA4)-immunoglobulin; and targeted synthetic (ts) DMARDs which include phosphodiesterase-4 (PDE4) and Janus kinase (JAK) inhibitors [ 1 , 8 ].
Despite the number of available treatment options, the majority of patients with PsA report that they do not achieve remission and additional therapeutic options are needed [ 9 , 10 ]. Thus, the treatment landscape for PsA continues to evolve and treatment decisions increase in complexity, especially as direct comparative data are limited [ 2 ].
Bimekizumab is a monoclonal IgG1 antibody that selectively inhibits IL-17F in addition to IL-17A, which is approved for the treatment of adults with active PsA in Europe [ 11 , 12 ]. Both IL-17A and IL-17F are pro-inflammatory cytokines implicated in PsA [ 11 , 13 ]. IL-17F is structurally similar to IL-17A and expressed by the same immune cells; however, the mechanisms that regulate expression and kinetics differ [ 13 , 14 ]. IL-17A and IL-17F are expressed as homodimers and as IL-17A–IL-17F heterodimers that bind to and signal via the same IL-17 receptor A/C complex [ 13 , 15 ].
In vitro studies have demonstrated that the dual inhibition of both IL-17A and IL-17F with bimekizumab was more effective at suppressing PsA inflammatory genes and T cell and neutrophil migration, and periosteal new bone formation, than blocking IL-17A alone [ 11 , 14 , 16 , 17 ]. Furthermore, IL-17A and IL-17F protein levels are elevated in psoriatic lesions and the superiority of bimekizumab 320 mg every 4 weeks (Q4W) or every 8 weeks (Q8W) over the IL-17A inhibitor, secukinumab, in complete clearance of psoriatic skin was demonstrated in a head-to-head trial in PSO [ 16 , 18 ]. Collectively, this evidence suggests that neutralizing both IL-17F and IL-17A may provide more potent abrogation of IL-17-mediated inflammation than IL-17A alone.
Bimekizumab 160 mg Q4W demonstrated significant improvements in efficacy outcomes compared with placebo, and an acceptable safety profile in adults with PsA in the phase 3 RCTs BE OPTIMAL (NCT03895203) (b/tsDMARD-naïve patients) and BE COMPLETE (NCT03896581) (TNFi inadequate responders) [ 19 , 20 ].
The objective of this study was to establish the comparative efficacy and safety of bimekizumab 160 mg Q4W vs other available PsA treatments, using network meta-analysis (NMA).
Search strategy
A systematic literature review (SLR) was conducted according to the Preferred Reporting Items for Systematic Reviews (PRISMA) guidelines [ 21 ] and adhered to the principles outlined in the Cochrane Handbook for Systematic Reviews of Interventions, Centre for Reviews and Dissemination’s Guidance for Undertaking Reviews in Healthcare, and Methods for the Development of National Institute of Health and Care Excellence (NICE) Public Health Guidance [ 22–24 ]. The SLR of English-language publications was originally conducted on 3 December 2015, with updates on 7 January 2020, 2 May 2022 and 1 January 2023 in Medical Literature Analysis and Retrieval System Online (MEDLINE ® ), Excerpta Medica Database (Embase ® ) and the Cochrane Central Register of Controlled Trials (CENTRAL) for literature published from January 1991 onward using the Ovid platform. Additionally, bibliographies of SLRs and meta-analyses identified through database searches were reviewed to ensure any publications not identified in the initial search were included in this SLR. Key clinical conference proceedings not indexed in Ovid (from October 2019 to current) and ClinicalTrials.gov were also manually searched. The search strategy is presented in Supplementary Table S1 (available at Rheumatology online).
Study inclusion
Identified records were screened independently and in duplicate by two reviewers and any discrepancies were reconciled via discussion or a third reviewer. The SLR inclusion criteria were defined by the Patient populations, Interventions, Comparators, Outcome measures, and Study designs (PICOS) Statement ( Supplementary Table S2 , available at Rheumatology online). The SLR included published studies assessing approved therapies for the treatment of PsA. Collected data included study and patient population characteristics, interventions, comparators, and reported clinical and patient-reported outcomes relevant to PsA. For efficacy outcomes, pre-crossover data were extracted in studies where crossover occurred. All publications included in the analysis were evaluated according to the Cochrane risk-of-bias tool for randomized trials as described in the Cochrane Handbook [ 25 ].
Network meta-analysis methods
NMA is the quantitative assessment of relative treatment effects and associated uncertainty of two or more interventions [ 26 , 27 ]. It is used frequently in health technology assessment, guideline development and to inform treatment decision making in clinical practice [ 26 ].
Bimekizumab 160 mg Q4W was compared with current b/tsDMARDs at regulatory-approved doses ( Table 1 ) by NMA. All comparators were selected on the basis they were relevant to clinical practice, i.e. recommended by key clinical guidelines, licensed by key regulatory bodies and/or routinely used.
NMA intervention and comparators
| Therapeutic class . | Drug dose and frequency of administration . |
|---|---|
| Intervention | |
| IL-17A/17Fi | Bimekizumab 160 mg Q4W |
| Comparators | |
| IL-17Ai | Secukinumab 150 mg with or without loading dose Q4W or 300 mg Q4W, ixekizumab 80 mg Q4W |
| IL-23i | Guselkumab 100 mg every Q4W or Q8W, risankizumab 150 mg Q4W |
| IL-12/23i | Ustekinumab 45 mg or 90 mg Q12W |
| TNFi | Adalimumab 40 mg Q2W, certolizumab pegol 200 mg Q2W or 400 mg Q4W pooled, etanercept 25 mg twice a week, golimumab 50 mg s.c. Q4W or 2 mg/kg i.v. Q8W, infliximab 5 mg/kg on weeks 0, 2, 6, 14, 22 |
| CTLA4-Ig | Abatacept 150 mg Q1W |
| JAKi | Tofacitinib 5 mg BID, upadacitinib 15 mg QD |
| PDE-4i | Apremilast 30 mg BID |
| Other | Placebo |
See Supplementary Table S4 , available at Rheumatology online for additional dosing schedules used in included studies. BID: twice daily; CTLA4-Ig: cytotoxic T lymphocyte antigen 4-immunoglobulin; IL-17A/17Fi: IL-17A/17F inhibitor; IL-17Ai: IL-17A inhibitor; IL-12/23i: IL-12/23 inhibitor; IL-23i: IL-23 inhibitor; JAKi: Janus kinase inhibitor; NMA: network meta-analysis; PDE-4i: phosphodiesterase-4 inhibitor; Q1W: once weekly; Q2W: every 2 weeks; Q4W: every 4 weeks; Q8W: every 8 weeks; Q12W: every 12 weeks; QD: once daily; TNFi: TNF inhibitor.
Two sets of primary analyses were conducted, one for a b/tsDMARD-naïve PsA population and one for a TNFi-experienced PsA population. Prior treatment with TNFis has been shown to impact the response to subsequent bDMARD treatments [ 28 ]. In addition, most trials involving b/tsDMARDs for the treatment of PsA (including bimekizumab) report separate data on both b/tsDMARD-naïve and TNFi-experienced subgroups, making NMA in each of these patient populations feasible.
For each population the following outcomes were analysed: American College of Rheumatology response (ACR20/50/70), Psoriasis Area and Severity Index (PASI90/100), and minimal disease activity (MDA). The analysis of serious adverse events (SAE) was conducted using a mixed population (i.e. b/tsDMARD-naïve, TNFi-experienced and mixed population data all were included) as patients’ previous TNFI exposure was not anticipated to impact safety outcomes following discussions with clinicians. The NMA included studies for which data were available at week 16, if 16-week data were not available (or earlier crossover occurred), data available at weeks 12, 14 or 24 were included. Pre-crossover data were included in the analyses for efficacy outcomes to avoid intercurrent events.
Heterogeneity between studies for age, sex, ethnicity, mean time since diagnosis, concomitant MTX, NSAIDs or steroid use was assessed using Grubb’s test, also called the extreme Studentized deviate method, to identify outlier studies.
All univariate analyses involved a 10 000 run-in iteration phase and a 10 000-iteration phase for parameter estimation. All calculations were performed using the R2JAGS package to run Just Another Gibbs Sampler (JAGS) 3.2.3 and the code reported in NICE Decision Support Unit (DSU) Technical Support Document Series [ 29–33 ]. Convergence was confirmed through inspection of the ratios of Monte-Carlo error to the standard deviations of the posteriors; values >5% are strong signs of convergence issues [ 31 ]. In some cases, trials reported outcome results of zero (ACR70, PASI100, SAE) in one or more arms for which a continuity correction was applied to mitigate the issue, as without the correction most models were not convergent or provided a large posterior distribution making little clinical sense [ 31 ].
Four NMA models [fixed effects (FE) unadjusted, FE baseline risk-adjusted, random effects (RE) unadjusted and RE baseline risk-adjusted] were assessed and the best-fit models were chosen using methods described in NICE DSU Technical Support Document 2 [ 31 ]. Odds ratios (ORs) and differences of mean change (MC) with the associated 95% credible intervals (CrIs) were calculated for each treatment comparison in the evidence network for the best fitting models and presented in league tables and forest plots. In addition, the probability of bimekizumab 160 mg Q4W being better than other treatments was calculated using surface under the cumulative ranking curve (SUCRA) to determine relative rank. Conclusions (i.e. better/worse or comparable) for bimekizumab 160 mg Q4W vs comparators were based on whether the pairwise 95% CrIs of the ORs/difference of MC include 1 (dichotomous outcomes), 0 (continuous outcomes) or not. In the case where the 95% CrI included 1 or 0, then bimekizumab 160 mg Q4W and the comparator were considered comparable. If the 95% CrI did not include 1 or 0, then bimekizumab 160 mg Q4W was considered either better or worse depending on the direction of the effect.
Compliance with ethics guidelines
This article is based on previously conducted studies and does not contain any new studies with human participants or animals performed by any of the authors.
Study and patient characteristics
The SLR identified 4576 records through databases and 214 records through grey literature, of which 3143 were included for abstract review. Following the exclusion of a further 1609 records, a total of 1534 records were selected for full-text review. A total of 66 primary studies from 246 records were selected for data extraction. No trial was identified as having a moderate or high risk of bias ( Supplementary Table S3 , available at Rheumatology online).
Of the 66 studies identified in the SLR, 41 studies reported outcomes at weeks 12, 16 or 24 and met the criteria for inclusion in the NMA in either a b/tsDMARD-naïve population ( n = 20), a TNFi-experienced population ( n = 5), a mixed population with subgroups ( n = 13) or a mixed PsA population without subgroups reported ( n = 3). The PRISMA diagram is presented in Fig. 1 . Included and excluded studies are presented in Supplementary Tables S4 and S5 , respectively (available at Rheumatology online).

PRISMA flow diagram. The PRISMA flow diagram for the SLR conducted to identify published studies assessing approved treatments for the treatment of PsA. cDMARD: conventional DMARD; NMA: network meta-analysis; NR: not reported; PD: pharmacodynamic; PK: pharmacokinetic; PRISMA: Preferred Reporting Items for Systematic Reviews and Meta-Analyses; RCT: randomized controlled trial; SLR: systematic literature review
The baseline study and patient characteristics (where reported) are presented in Supplementary Table S6 (available at Rheumatology online). There were 20–483 patients included in treatment arms. The median age of patients was 48.9 years, the median percentage of males was 50.3% and a median of 92.3% of patients were Caucasian. Patients had a mean time since diagnosis of 7.6 years and a mean PASI score of 8.7. The mean (range) use of concomitant MTX, NSAIDs and steroids were 53.9% (29.1% to 84.0%), 72.4% (33.3% to 100.0%) and 16.8% (9.2% to 30.0%), respectively. Heterogeneity was generally low across studies except for the concomitant use of MTX, NSAIDs and steroids. Using an approach consistent with established NMA methods in PsA [ 34–36 ], a meta-regression model using JAGS code reported in NICE DSU Technical Support Document 3 [ 33 ] was used to account for variation in placebo responses when model-fit statistics suggested that baseline risk-adjusted models provided a better fit to the data.
NMA results
The network diagrams for ACR50 in b/tsDMARD-naïve and TNFi-experienced patients are presented in Fig. 2A and B with network diagrams for other outcomes presented in Supplementary Fig. S1 (available at Rheumatology online). The networks for ACR response were larger, in terms of both number of studies and patients included, than the networks for PASI. Similarly, the networks for b/tsDMARD-naïve patients were larger than TNFi-experienced patients across all outcomes analysed. Placebo was used as a common comparator in all networks and there were a few studies that included more than two arms (OPAL-Broaden, Select-PsA-1, SPIRIT-P1 and BE OPTIMAL) that included adalimumab as the reference arm in b/tsDMARD-naïve patients. Lastly, networks included studies where the primary outcome was evaluated at time points longer than 16 weeks (e.g. EXCEED study at 52 weeks) but as per the methods, 16-week data formed the network.

Network of evidence for ACR50. ( A ) b/tsDMARD-naïve patients. ( B ) TNFi-experienced patients. The size of the circle representing each intervention is proportional to the number of patients included in the analysis. The line width is proportional to the number of studies connecting the interventions. ABA: abatacept; ADA: adalimumab; APR: apremilast; b/tsDMARD-naïve: biologic and targeted synthetic DMARD-naïve; BKZ: bimekizumab; CZP: certolizumab pegol; ETA: etanercept; GOL: golimumab; GUS: guselkumab; IFX: infliximab; IV: intravenous; IXE: ixekizumab; PBO: placebo; Q4W: every 4 weeks; Q8W: every 8 weeks; RIS: risankizumab; SEC: secukinumab; TNFi-experienced: TNF inhibitor–experienced; TOF: tofacitinib; UPA: upadacitinib; UST: ustekinumab; w/o LD: without loading dose
The best-fit model is noted for each outcome with full model fit statistics for all outcomes presented in Supplementary Table S7 (available at Rheumatology online). Forest plots for ACR50 and PASI100 are presented in Figs 3 and 4 , with forest plots for other outcomes, along with the league tables in Supplementary Fig. S2 and Table S8 , respectively (available at Rheumatology online).

ACR50. The results for the NMA on ACR50 at week 16. ( A ) b/tsDMARD-naïve patients including forest plot and SUCRA values. FE baseline–adjusted model DIC = 469.59. ( B ) TNFi-experienced patients including forest plot and SUCRA values. RE-unadjusted model DIC = 205.33. a Week 24 data were used as week 16 data was not available. * The 95% CrI does not include 1; bimekizumab 160 mg Q4W is considered either better or worse depending on the direction of the effect. ABA: abatacept; ADA: adalimumab; APR: apremilast; b/tsDMARD-naïve: biologic and targeted synthetic DMARD-naïve; BKZ: bimekizumab; CrI: credible interval; CZP: certolizumab pegol; DIC: deviance information criterion; ETA: etanercept; FE: fixed effects; GOL: golimumab; GUS: guselkumab; IFX: infliximab; IV: intravenous; IXE: ixekizumab; NMA: network meta-analysis; PBO: placebo; Q4W: every 4 weeks; Q8W: every 8 weeks; RE: random effects; RIS: risankizumab; SEC: secukinumab; SUCRA: surface under the cumulative ranking curve; TNFi-experienced: TNF inhibitor–experienced; TOF: tofacitinib; UPA: upadacitinib; UST: ustekinumab; w/o LD: without loading dose

PASI100. The results for the NMA on PASI100 at week 16: ( A ) b/tsDMARD-naïve patients including forest plot and SUCRA values. FE baseline–adjusted model DIC = 150.27. ( B ) TNFi-experienced patients including forest plot and SUCRA values. RE-unadjusted model DIC = 81.76. a Week 24 data were used as week 16 data was not available. * The 95% CrI does not include 1; bimekizumab 160 mg 4W is considered better. ADA: adalimumab; b/tsDMARD-naïve: biologic and targeted synthetic DMARD-naïve; BKZ, bimekizumab; CrI, credible interval; CZP, certolizumab pegol; DIC, deviance information criterion; FE, fixed effects; GOL, golimumab; GUS, guselkumab; IXE, ixekizumab; NMA, network meta-analysis; PASI, Psoriasis Area and Severity Index; PBO, placebo; Q4W, every 4 weeks; Q8W, every 8 weeks; RE, random effects; SEC, secukinumab; SUCRA, surface under the cumulative ranking curve; TNFi-experienced, TNF inhibitor–experienced; UPA, upadacitinib
Joint outcomes
For ACR50 outcomes, the best-fit models for b/tsDMARD-naïve and TNFi-experienced were the FE baseline–adjusted model and RE-unadjusted model, respectively.
b/tsDMARD-naïve patients
Bimekizumab 160 mg Q4W ranked 6th for ACR20 (SUCRA = 0.75), 5th for ACR50 (SUCRA = 0.74) ( Fig. 3A ) and 3rd for ACR70 (SUCRA = 0.80) among 21 treatments. For ACR50, bimekizumab 160 mg Q4W was better than placebo, abatacept 125 mg, guselkumab 100 mg Q4W, ustekinumab 45 mg, risankizumab 150 mg, guselkumab 100 mg Q8W and ustekinumab 90 mg; worse than golimumab 2 mg i.v.; and comparable to the remaining treatments in the network ( Fig. 3A ).
TNFi-experienced patients
Bimekizumab 160 mg Q4W ranked 1st among 16 treatments for ACR20 (SUCRA = 0.96), 2nd among 15 treatments for ACR50 (SUCRA = 0.84) ( Fig. 3B ) and 1st among 16 treatments for ACR70 (SUCRA = 0.83). Bimekizumab 160 mg Q4W was better than placebo, abatacept 125 mg, secukinumab 150 mg without loading dose, tofacitinib 5 mg and secukinumab 150 mg; and comparable to the remaining treatments in the network on ACR50 ( Fig. 3B ).
Skin outcomes
For PASI100 outcomes, the best-fit models for b/tsDMARD-naïve and TNFi-experienced were the FE baseline–adjusted model and RE-unadjusted model, respectively.
Bimekizumab 160 mg Q4W ranked 2nd among 15 treatments (SUCRA = 0.89) for PASI90 and 1st among 11 treatments (SUCRA = 0.95) for PASI100 ( Fig. 4A ). Bimekizumab 160 mg Q4W was better than placebo, certolizumab pegol pooled, golimumab 2 mg i.v., secukinumab 150 mg, adalimumab 40 mg, upadacitinib 15 mg, secukinumab 300 mg and ixekizumab 80 mg Q4W; and comparable to the remaining treatments in the network on PASI100 ( Fig. 4A ).
Bimekizumab 160 mg Q4W ranked 1st among 10 treatments (SUCRA = 0.85) for PASI90 and 2nd among 7 treatments (SUCRA = 0.79) for PASI100 ( Fig. 4B ). Bimekizumab 160 mg Q4W was better than placebo, ixekizumab 80 mg Q4W and upadacitinib 15 mg; and comparable to the remaining treatments in the network on PASI100 ( Fig. 4B ).
For MDA, the best-fit models for b/tsDMARD-naïve and TNFi-experienced were the FE baseline–adjusted model and RE-unadjusted model, respectively.
Bimekizumab 160 mg Q4W ranked 1st among 13 treatments (SUCRA = 0.91) and was better than placebo [OR (95% CrI) 6.31 (4.61–8.20)], guselkumab 100 mg Q4W [2.06 (1.29–3.10)], guselkumab 100 mg Q8W [1.76 (1.09–2.69)], risankizumab 150 mg [1.99 (1.40–2.76)] and adalimumab 40 mg [1.41 (1.01–1.93)]; and comparable to the remaining treatments in the network ( Supplementary Fig. S2G , available at Rheumatology online).
Bimekizumab 160 mg Q4W ranked 1st among 11 treatments (SUCRA = 0.83) and was better than placebo [12.10 (5.31–28.19)] and tofacitinib 5 mg [6.81 (2.14–21.35)]; and comparable to the remaining treatments in the network ( Supplementary Fig. S2H , available at Rheumatology online).
The network for SAEs for a mixed population included 23 treatments and the best-fit model was an RE-unadjusted model (due to study populations and time point reporting heterogeneity). Bimekizumab 160 mg Q4W showed comparable safety to all treatments in the network ( Supplementary Fig. S2I , available at Rheumatology online).
The treatment landscape for PsA is complex, with numerous treatment options and limited direct comparative evidence. Bimekizumab 160 mg Q4W has recently been approved for the treatment of active PsA by the European Medicines Agency and recommended by NICE in the UK, and the published phase 3 results warrant comparison with existing therapies by NMA.
This NMA included 41 studies evaluating 22 b/tsDMARDs including the novel IL-17F and IL-17A inhibitor, bimekizumab. Overall, bimekizumab 160 mg Q4W ranked favourably among b/tsDMARDS for efficacy in joint, skin and disease activity outcomes in PsA across both b/tsDMARD-naïve and TNFi-experienced populations. The safety of bimekizumab 160 mg Q4W was similar to the other b/tsDMARDs.
The Group for Research and Assessment of Psoriasis and Psoriatic Arthritis (GRAPPA) and EULAR provide evidence-based recommendations for the treatment of PsA [ 1 , 2 ]. To treat peripheral arthritis symptoms in PsA, efficacy across the classes of current b/tsDMARDs are considered similar by both GRAPPA and EULAR, in part due to a lack of data comparing licensed therapies in a head-to-head trial setting [ 1 , 2 ]. EULAR recommends the use of JAK inhibitors in the case of inadequate response, intolerance or when a bDMARD is not appropriate [ 1 ]. This recommendation was made when tofacitinib was the only available JAK inhibitor, but reflects current marketing authorizations for tofacitinib and upadacitinib which indicate use in patients with an inadequate response or prior intolerance to TNFis (USA) or bDMARDs (Europe) [ 37–40 ]. This NMA suggests that bimekizumab 160 mg Q4W may have an advantage over current treatments, including IL-23 inhibitors in b/tsDMARD naïve patients, and secukinumab 150 mg and tofacitinib in TNFi-experienced patients, as evidenced by our analysis of ACR50 for which the pairwise comparisons were significantly in favour of bimekizumab 160 mg Q4W.
For the treatment of skin symptoms in PsA, IL-23, IL-12/23 and IL-17A inhibitors are currently recommended due to their greater efficacy compared with TNFis [ 1 , 4 ]. GRAPPA also suggests considering efficacy demonstrated in direct comparative studies in PSO when selecting a treatment for PsA skin symptoms [ 2 ]. In our analysis of complete skin clearance as measured by PASI100, bimekizumab 160 mg Q4W demonstrated the likelihood of significantly greater efficacy than IL-17A, JAK inhibitors and TNFis in b/tsDMARD-naïve patients and IL-17A and JAK inhibitors in TNFi-experienced patients. Furthermore, the NMA results for skin clearance in PsA are in alignment with previous studies in PSO that demonstrated superiority of bimekizumab 320 mg Q4W or Q8W vs secukinumab, ustekinumab and adalimumab ( P < 0.001) (note that the dosing of bimekizumab in PSO differs from that in PsA) [ 12 , 18 , 41 , 42 ].
There are similarities between our results and other recently published NMAs of b/tsDMARDs in PsA, although methodological heterogeneity across all NMAs makes comparisons challenging [ 34–36 , 43–45 ]. Among recent NMAs, the largest evaluated 21 treatments [ 34 ] and only four considered subgroups of b/tsDMARD-naïve and TNFi-experienced patients or those with inadequate response [ 35 , 36 , 43 , 45 ]. Furthermore, different or pooled levels of response were evaluated for ACR and PASI outcomes.
Previous NMAs also support IL-17, IL-12/23 and IL-23 inhibitors having greater efficacy for skin symptoms than TNFis [ 35 , 36 ]. In an overall PsA population, McInnes et al. demonstrated that secukinumab 300 mg, ixekizumab 80 mg Q4W, and ustekinumab 45 mg and 90 mg were likely more efficacious than TNFis for PASI90 [ 35 ]. In another NMA by Ruyssen-Witrand et al. , results suggested that ixekizumab 80 mg Q4W had significantly greater efficacy than adalimumab, certolizumab pegol pooled, and etanercept 25 mg twice weekly/50 mg once weekly for any PASI score (50%, 75%, 90% and 100% reduction) in bDMARD-naïve patients [ 36 ].
For joint outcomes, Mease et al. compared guselkumab Q4W and Q8W with other b/tsDMARDs in a network of 21 treatments in an overall PsA population for ACR50 [ 34 ]. Both guselkumab dosing schedules were better than abatacept and apremilast, but golimumab 2 mg i.v. had a higher likelihood of ACR50 response than guselkumab Q8W [ 34 ]. Despite MDA being assessed in clinical trials for bDMARD therapies and a treatment target in PsA [ 46 ], evidence for comparative efficacy for this outcome is limited. None of the most recent NMAs before this one included an analysis of MDA [ 34–36 ]. With regard to safety outcomes, previous NMAs evaluating SAEs also resulted in either no difference between b/tsDMARDs vs placebo or other b/tsDMARDs [ 34 , 36 , 44 , 45 ].
This study has a number of strengths. To our knowledge this NMA represents the most comprehensive and in-depth comparative efficacy analysis of approved treatments in PsA to date. The evidence was derived from a recent SLR, ensuring that new RCTs and updated results from previously published RCTs were included. It is also the first NMA to include the phase 3 BE COMPLETE and BE OPTIMAL trials of bimekizumab [ 19 , 20 ]. Our NMA used robust methods and accounted for variation in placebo response through network meta-regression in accordance with NICE DSU Technical Support Documents [ 31–33 ]. As an acknowledgement of the evolution of treatment advances, separate analyses of b/tsDMARD-naïve and TNFi-experienced subgroups were conducted with the intent to assist healthcare decision-making in different clinical settings. In addition, a panel of clinical experts were consulted from project inception and are authors of this paper, ensuring inclusion of a comprehensive set of clinically meaningful outcomes, including the composite, treat-to-target outcome of MDA.
Despite the robust evidence base and methodology, this NMA has limitations. Indirect treatment comparisons such as this NMA are not a substitute for head-to-head trials. There was heterogeneity in the endpoints and reporting in the included studies. Fewer studies reporting PASI outcomes resulted in smaller networks compared with the network of studies evaluating ACR response criteria. Not all trials reported outcomes at the same timepoint, thereby reducing the comparability of trial results, which has been transparently addressed by noting where week 24 data were used vs week 12, 14 or 16 data. The analyses for the TNFi-experienced population were limited by potential heterogeneity, especially in the analyses where fewer studies were included in the networks, as this group could include patients who had an inadequate response to TNFi or discontinued TNFi treatment due to other reasons (e.g. lost access). Also, in the analyses for the TNFi-experienced population, very low patient numbers for some treatments resulted in less statistical power. Additionally, the data included in the analysis were derived exclusively from RCTs, for which the study populations may not reflect a typical patient population seen in real-world practice. For example, trial results may be different in patients with oligoarthritis who are not well-represented in clinical trials.
Over the years covering our SLR, we acknowledge that patient populations and the PsA treatment landscape have evolved. After a thorough review of baseline patient characteristics, no significant differences were observed across the studies included in the NMA. To further mitigate uncertainty, baseline regression was used to actively correct for changes in the placebo rate over time ensuring a consistent and fair comparison across all included treatments. In addition, our analyses were conducted in separate b/tsDMARD-naïve and TNFi-experienced populations that reflect the evolving PsA patient population over time. Radiographic progression was not within the purview of this NMA because the NMA focused on a shorter timeframe than the 52-week duration typically recommended by the literature for investigating radiographic progression. Furthermore, there is existing literature on this topic, as exemplified by the work of Wang et al. in 2022 [ 47 ]. Nevertheless, the comprehensive and current evidence base, examination of multiple endpoints, and consistency with previous reported NMAs lend credence to our results.
Overall, the results of this NMA demonstrated the favourable relative efficacy and safety of bimekizumab 160 mg Q4W vs all approved treatments for PsA. Bimekizumab ranked high in terms of efficacy on joint, skin and MDA outcomes in both b/tsDMARD-naïve and TNFi-experienced patient populations, and showed comparable safety to other treatments. In the evolving PsA treatment landscape, bimekizumab 160 mg Q4W is a potentially beneficial treatment option for patients with PsA.
Supplementary material is available at Rheumatology online.
The datasets generated during and/or analysed during the current study are available from the corresponding author on reasonable request.
This study was funded in full by UCB Pharma.
Disclosure statement : P.J.M.: has received research grants from AbbVie, Amgen, BMS, Eli Lilly, Gilead, Janssen, Novartis, Pfizer, Sun Pharma and UCB Pharma; consultancy fees from AbbVie, Acelyrin, Aclaris, Amgen, BMS, Boehringer Ingelheim, Eli Lilly, Galapagos, Gilead, GSK, Janssen, Moonlake Pharma, Novartis, Pfizer, Sun Pharma and UCB Pharma; and speakers’ bureau for AbbVie, Amgen, Eli Lilly, Janssen, Novartis, Pfizer and UCB Pharma. L.C.C.: received grants/research support from AbbVie, Amgen, Celgene, Eli Lilly, Janssen, Novartis, Pfizer and UCB; worked as a paid consultant for AbbVie, Amgen, Bristol Myers Squibb, Celgene, Eli Lilly, Gilead, Galapagos, Janssen, Moonlake, Novartis, Pfizer and UCB; and has been paid as a speaker for AbbVie, Amgen, Biogen, Celgene, Eli Lilly, Galapagos, Gilead, GSK, Janssen, Medac, Novartis, Pfizer and UCB. D.D.G.: consultant and/or received grant support from Abbvie, Amgen, BMS, Celgene, Eli Lilly, Galapagos, Gilead, Janssen, Novartis, Pfizer and UCB. J.F.M.: consultant and/or investigator for AbbVie, Amgen, Biogen, BMS, Dermavant, Eli Lilly, Janssen, LEO Pharma, Novartis, Pfizer, Regeneron, Sanofi, Sun Pharma and UCB Pharma. P.N.: research grants, clinical trials and honoraria for advice and lectures on behalf of AbbVie, Boehringer Ingelheim, BMS, Eli Lilly, Galapagos/Gilead, GSK, Janssen, Novartis, Pfizer, Samsung, Sanofi and UCB Pharma. S.G. and V.L.-K.: employees of Cytel, Inc. which served as a consultant on the project. A.R.P., D.W. and V.T.: employees and stockholders of UCB Pharma.
The authors acknowledge Leah Wiltshire of Cytel for medical writing and editorial assistance based on the authors’ input and direction, Heather Edens (UCB Pharma, Smyrna, GA, USA) for publication coordination and Costello Medical for review management, which were funded by UCB Pharma. This analysis was funded by UCB Pharma in accordance with Good Publication Practice (GPP 2022) guidelines ( http://www.ismpp.org/gpp-2022 ). Data were previously presented at ISPOR-US 2023 (Boston, MA, USA, 7–10 May 2023).
Gossec L , Baraliakos X , Kerschbaumer A et al. EULAR recommendations for the management of psoriatic arthritis with pharmacological therapies: 2019 update . Ann Rheum Dis 2020 ; 79 : 700 – 12 .
Google Scholar
Coates LC , Soriano ER , Corp N et al. ; GRAPPA Treatment Recommendations domain subcommittees . Group for Research and Assessment of Psoriasis and Psoriatic Arthritis (GRAPPA): updated treatment recommendations for psoriatic arthritis 2021 . Nat Rev Rheumatol 2022 ; 18 : 465 – 79 .
Fitzgerald O , Ogdie A , Chandran V et al. Psoriatic arthritis . Nat Rev Dis Primers 2021 ; 7 : 59 .
Coates LC , Soriano ER , Corp N et al. Treatment recommendations domain subcommittees. Group for Research and Assessment of Psoriasis and Psoriatic Arthritis (GRAPPA): updated treatment recommendations for psoriatic arthritis 2021 . Nat Rev Rheumatol 2022 ; 27 : 1 – 15 .
Najm A , Goodyear CS , McInnes IB , Siebert S. Phenotypic heterogeneity in psoriatic arthritis: towards tissue pathology-based therapy . Nat Rev Rheumatol 2023 ; 19 : 153 – 65 .
Ogdie A , Weiss P. The epidemiology of psoriatic arthritis . Rheum Dis Clin North Am 2015 ; 41 : 545 – 68 .
Alinaghi F , Calov M , Kristensen LE et al. Prevalence of psoriatic arthritis in patients with psoriasis: a systematic review and meta-analysis of observational and clinical studies . J Am Acad Dermatol 2019 ; 80 : 251 – 65.e19 .
Singh JA , Guyatt G , Ogdie A et al. Special Article: 2018 American college of rheumatology/national psoriasis foundation guideline for the treatment of psoriatic arthritis . Arthritis Rheumatol 2019 ; 71 : 5 – 32 .
Coates LC , Robinson DE , Orbai AM et al. What influences patients' opinion of remission and low disease activity in psoriatic arthritis? Principal component analysis of an international study . Rheumatology (Oxford) 2021 ; 60 : 5292 – 9 .
Gondo G , Mosca M , Hong J et al. Demographic and clinical factors associated with patient-reported remission in psoriatic arthritis . Dermatol Ther (Heidelb) 2022 ; 12 : 1885 – 95 .
Glatt S , Baeten D , Baker T et al. Dual IL-17A and IL-17F neutralisation by bimekizumab in psoriatic arthritis: evidence from preclinical experiments and a randomised placebo-controlled clinical trial that IL-17F contributes to human chronic tissue inflammation . Ann Rheum Dis 2018 ; 77 : 523 – 32 .
UCB Pharma S.A . Bimzelx ® (bimekizumab): Summary of Product Characteristics. 2023 . https://www.ema.europa.eu/en/medicines/human/EPAR/bimzelx (26 June 2023, date last accessed).
Adams R , Maroof A , Baker T et al. Bimekizumab, a novel humanized IgG1 antibody that neutralizes both IL-17A and IL-17F . Front Immunol 2020 ; 11 : 1894 .
Burns LA , Maroof A , Marshall D et al. Presence, function, and regulation of IL-17F-expressing human CD4(+) T cells . Eur J Immunol 2020 ; 50 : 568 – 80 .
Kuestner R , Taft D , Haran A et al. Identification of the IL-17 receptor related molecule IL-17RC as the receptor for IL-17F . J Immunol 2007 ; 179 : 5462 – 73 .
Johansen C , Usher PA , Kjellerup RB et al. Characterization of the interleukin-17 isoforms and receptors in lesional psoriatic skin . Br J Dermatol 2009 ; 160 : 319 – 24 .
Shah M , Maroof A , Gikas P et al. Dual neutralisation of IL-17F and IL-17A with bimekizumab blocks inflammation-driven osteogenic differentiation of human periosteal cells . RMD Open 2020 ; 6 : e001306 .
Reich K , Warren RB , Lebwohl M et al. Bimekizumab versus Secukinumab in Plaque Psoriasis . New Engl J Med 2021 ; 385 : 142 – 52 .
McInnes IB , Asahina A , Coates LC et al. Bimekizumab in patients with psoriatic arthritis, naive to biologic treatment: a randomised, double-blind, placebo-controlled, phase 3 trial (BE OPTIMAL) . Lancet 2023 ; 401 : 25 – 37 .
Merola JF , Landewe R , McInnes IB et al. Bimekizumab in patients with active psoriatic arthritis and previous inadequate response or intolerance to tumour necrosis factor-alpha inhibitors: a randomised, double-blind, placebo-controlled, phase 3 trial (BE COMPLETE) . Lancet 2023 ; 401 : 38 – 48 .
Page MJ , McKenzie JE , Bossuyt PM et al. The PRISMA 2020 statement: an updated guideline for reporting systematic reviews . BMJ 2021 ; 372 : n71 .
Higgins JP. Cochrane handbook for systematic reviews of interventions. Vol. 2. 2nd edn. Chichester, UK: John Wiley & Sons, 2019 .
National Institute for Health and Care Excellence . The guidelines manual: Process and methods [PMG6]. 2012 . https://www.nice.org.uk/process/pmg6/chapter/introduction (3 March 2023, date last accessed).
Booth AM , Wright KE , Outhwaite H. Centre for Reviews and Dissemination databases: value, content, and developments . Int J Technol Assess Health Care 2010 ; 26 : 470 – 2 .
Sterne JAC , Savovic J , Page MJ et al. RoB 2: a revised tool for assessing risk of bias in randomised trials . BMJ 2019 ; 366 : l4898 .
Daly C , Dias S , Welton N , Anwer S , Ades A. NICE Guidelines Technical Support Unit. Meta-Analysis: Guideline Methodology Document 1 (Version 1). 2021 . http://www.bristol.ac.uk/population-health-sciences/centres/cresyda/mpes/nice/guideline-methodology-documents-gmds/ (1 March 2023, date last accessed).
Dias S , Caldwell DM. Network meta-analysis explained . Archi Dis Childhood Fetal Neonatal Ed 2019 ; 104 : F8 – F12 .
Merola JF , Lockshin B , Mody EA. Switching biologics in the treatment of psoriatic arthritis . Semin Arthritis Rheum 2017 ; 47 : 29 – 37 .
Openbugs (website) 2014 . http://www.openbugs.net/w/FrontPage (6 April 2023, date last accessed).
Lunn D , Spiegelhalter D , Thomas A , Best N. The BUGS project: evolution, critique and future directions . Stat Med 2009 ; 28 : 3049 – 67 .
Dias S , Welton NJ , Sutton AJ , Ades AE. NICE DSU technical support document 2: a generalised linear modelling framework for pairwise and network meta-analysis of randomised controlled trials. London. 2016 . https://www.sheffield.ac.uk/nice-dsu/tsds/full-list (25 January 2023, date last accessed).
Dias S , Welton N , Sutton AJ , Caldwell DM , Lu G , Ades AE. NICE DSU technical support document 4: inconsistency in networks of evidence based on randomised controlled trials. 2011 . https://www.sheffield.ac.uk/nice-dsu/tsds/full-list (25 January 2023, date last accessed).
Dias S , Sutton AJ , Welton N , Ades AE. NICE DSU Technical support document 3: heterogeneity: subgroups, meta-regression, bias and bias-adjustment. 2011 . https://www.sheffield.ac.uk/nice-dsu/tsds/full-list (25 January 2023, date last accessed).
Mease PJ , McInnes IB , Tam LS et al. Comparative effectiveness of guselkumab in psoriatic arthritis: results from systematic literature review and network meta-analysis . Rheumatology (Oxford) 2021 ; 60 : 2109 – 21 .
McInnes IB , Sawyer LM , Markus K et al. Targeted systemic therapies for psoriatic arthritis: a systematic review and comparative synthesis of short-term articular, dermatological, enthesitis and dactylitis outcomes . RMD Open 2022 ; 8 : e002074 .
Ruyssen-Witrand A , Perry R , Watkins C et al. Efficacy and safety of biologics in psoriatic arthritis: a systematic literature review and network meta-analysis . RMD Open 2020 ; 6 : e001117 .
Pfizer Inc . XELJANZ ® (tofacitinib): Summary of Product Characteristics. 2022 . https://www.ema.europa.eu/en/medicines/human/EPAR/xeljanz (4 May 2023, date last accessed).
Pfizer Inc . XELJANZ ® (tofacitinib): US Prescribing Information. 2022 . https://labeling.pfizer.com/ShowLabeling.aspx?id=959 (4 May 2023, date last accessed).
Abbvie Inc . RINVOQ ® (upadacitinib) extended-release tablets, for oral use: US Prescribing Information. 2023 . https://www.rxabbvie.com/pdf/rinvoq_pi.pdf (4 May 2023, date last accessed).
AbbVie Deutschland GmbH & Co . KG. RINVOQ ® (upadacitinib): Summary of Product Characteristics. 2023 . https://www.ema.europa.eu/en/medicines/human/EPAR/rinvoq (4 May 2023, date last accessed).
Warren RB , Blauvelt A , Bagel J et al. Bimekizumab versus Adalimumab in Plaque Psoriasis . N Engl J Med 2021 ; 385 : 130 – 41 .
Reich K , Papp KA , Blauvelt A et al. Bimekizumab versus ustekinumab for the treatment of moderate to severe plaque psoriasis (BE VIVID): efficacy and safety from a 52-week, multicentre, double-blind, active comparator and placebo controlled phase 3 trial . Lancet 2021 ; 397 : 487 – 98 .
Gladman DD , Orbai AM , Gomez-Reino J et al. Network meta-analysis of tofacitinib, biologic disease-modifying antirheumatic drugs, and apremilast for the treatment of psoriatic arthritis . Curr Ther Res Clin Exp 2020 ; 93 : 100601 .
Qiu M , Xu Z , Gao W et al. Fourteen small molecule and biological agents for psoriatic arthritis: a network meta-analysis of randomized controlled trials . Medicine (Baltimore) 2020 ; 99 : e21447 .
Kawalec P , Holko P , Mocko P , Pilc A. Comparative effectiveness of abatacept, apremilast, secukinumab and ustekinumab treatment of psoriatic arthritis: a systematic review and network meta-analysis . Rheumatol Int 2018 ; 38 : 189 – 201 .
Gossec L , McGonagle D , Korotaeva T et al. Minimal disease activity as a treatment target in psoriatic arthritis: a review of the literature . J Rheumatol 2018 ; 45 : 6 – 13 .
Wang SH , Yu CL , Wang TY , Yang CH , Chi CC. Biologic disease-modifying antirheumatic drugs for preventing radiographic progression in psoriatic arthritis: a systematic review and network meta-analysis . Pharmaceutics 2022 ; 14 .
Supplementary data
| Month: | Total Views: |
|---|---|
| January 2024 | 715 |
| February 2024 | 637 |
| March 2024 | 596 |
| April 2024 | 535 |
| May 2024 | 462 |
| June 2024 | 350 |
| July 2024 | 301 |
Email alerts
Citing articles via.
- Rheumatology X/Twitter
- BSR Instagram
- BSR Facebook
- Recommend to Your Librarian
Affiliations
- Online ISSN 1462-0332
- Print ISSN 1462-0324
- Copyright © 2024 British Society for Rheumatology
- About Oxford Academic
- Publish journals with us
- University press partners
- What we publish
- New features
- Open access
- Institutional account management
- Rights and permissions
- Get help with access
- Accessibility
- Advertising
- Media enquiries
- Oxford University Press
- Oxford Languages
- University of Oxford
Oxford University Press is a department of the University of Oxford. It furthers the University's objective of excellence in research, scholarship, and education by publishing worldwide
- Copyright © 2024 Oxford University Press
- Cookie settings
- Cookie policy
- Privacy policy
- Legal notice
This Feature Is Available To Subscribers Only
Sign In or Create an Account
This PDF is available to Subscribers Only
For full access to this pdf, sign in to an existing account, or purchase an annual subscription.
- Open access
- Published: 27 June 2024
Unraveling the controversy between fasting and nonfasting lipid testing in a normal population: a systematic review and meta-analysis of 244,665 participants
- Ahmed B. Zaid ORCID: orcid.org/0000-0001-8268-4538 6 ,
- Samah M. Awad ORCID: orcid.org/0000-0003-0626-8115 2 ,
- Mona G El-Abd ORCID: orcid.org/0000-0002-0117-4307 1 ,
- Sara A. Saied ORCID: orcid.org/0009-0009-8183-7868 1 ,
- Shimaa K. Almahdy ORCID: orcid.org/0000-0002-3385-9562 3 ,
- AbdulRahman A Saied ORCID: orcid.org/0000-0001-8616-5874 4 ,
- Alshimaa M. Elmalawany ORCID: orcid.org/0000-0002-9297-8326 6 ,
- Hind S. AboShabaan 6 &
- Helmy S. Saleh 5
Lipids in Health and Disease volume 23 , Article number: 199 ( 2024 ) Cite this article
284 Accesses
Metrics details
The final decision to fast or not fast for routine lipid profile examination in a standard, healthy population is unclear. Whereas the United States and European protocols state that fasting for regular lipid analysis is unnecessary, the North American and Chinese guidelines still recommend fasting before routine lipid testing.
This study aimed to unravel the contradiction between the different protocols of lipid profile testing worldwide and clarify the effect of diet on lipid profile testing only in a regular, healthy population.
A literature search was conducted through May 2024. The analyses included studies performed from the date 2000 until now because the contradiction of guidelines for lipid profile testing appeared for the first time in this period. A planned internal validity evaluation was performed using the National Institute of Health (NIH) quality measurement tools for observational cohort, case‒control, controlled interventional, and cross-sectional studies. The data were synthesized according to RevMan 5.3.
Eight studies with a total of 244,665 participants were included. The standardized mean difference in cholesterol in six studies showed significant differences in overall effect among fasting and nonfasting states ( P < 0.00001), as did high-density lipoprotein cholesterol ( P < 0.00001). At the same time, with respect to triglycerides and low-density lipoprotein cholesterol, there were notable variations in the overall effect between the fasted and nonfasted states ( P < 0.00001 and P ≤ 0.001, respectively).
Conclusions
This meta-analysis concluded that fasting for lipid profile testing is preferred as a conservative model to reduce variability and increase consistency in patients’ metabolic status when sampling for lipid testing.
Introduction
Examining fasting blood lipid levels can offer valuable information about the effects of different diets and metabolic processes. However, it is important to consider whether these levels accurately reflect the impact of individual foods or meals consumed throughout the day. For 24 h, the human body remains in a state of nonfasting and absorptive state for more than 18 h [ 1 ]. In a study conducted by Acevedo-Fani and Singh [ 2 ], the processes of digesting, absorbing, incorporating into the circulatory system, and clearing lipids from different foods and meals were influenced by a range of factors that can be classified into two categories: modifiable and unmodifiable. Factors that cannot be changed include diseases, genetic history, sex, age, and menstrual status; however, lifestyle choices such as engaging in regular exercise, smoking cigarettes, consuming alcoholic beverages, taking prescription drugs, and making specific food choices are regarded as factors that can be modified. Various factors influence the body’s ability to process lipids [ 3 ]. In individuals with average weight and those who are obese, consuming a single meal with a higher total fat content leads to an increase in the postprandial response of chylomicron triglycerides [ 4 ].

Fasting and nonfasting lipid testing protocols. Fasting for eight hours is enough to reduce variability and increase consistency in patients’ metabolic status at the time of sampling for lipid testing
Although humans typically do not fast or consume less fat regularly, it was previously believed that blood samples for lipid assessment should be taken after 8–12 h of fasting. This was based on the changes in serum triglycerides during a fat tolerance test. Furthermore, fasting helps to prevent lipemic serum and ensures accurate measurement of low-density lipoprotein (LDL) levels using the commonly used Friedewald’s formula in the laboratory [ 5 ]. Nonfasting samples have numerous clear advantages:
Staying away from the difficulty of prolonged fasting and early morning sampling.
Minimizing the risk of hypoglycemia in diabetic patients.
A nonfasting state is better for cardiovascular risk prediction, according to the guidelines in many countries [ 6 , 7 ].
Research has demonstrated the strongest correlation between peak triglyceride levels measured four hours after meals and a cardiovascular event [ 8 , 9 ]. Furthermore, there is evidence suggesting a correlation between insulin resistance and lipid or lipoprotein levels after a meal [ 10 ]. In addition, postmeal triglyceride levels that are greater than average and lower levels of high-density lipoprotein (HDL) cholesterol can be strong indicators of insulin resistance [ 11 ]. Community-based studies have shown that consuming food and following nonfasting routines for routine lipid testing have resulted in minimal changes in lipid profiles that are not clinically significant [ 6 , 7 , 11 , 12 , 13 , 14 , 15 ].
Major prospective trials have reported significant changes in various lipid parameters. The changes recorded were as follows: triglycerides increased by 0.3 mmol/L (26 milligrammes/dL), total cholesterol decreased by 0.2 mmol/L (8 milligrammes/dL), HDL cholesterol decreased by 0.1 mmol/L (4 milligrammes/dL), LDL cholesterol decreased by 0.2 mmol/L (8 milligrammes/dL), the calculated remnant cholesterol increased by 0.2 mmol/L (8 milligrammes/dL), and the estimated non-HDL cholesterol increased by 0.2 mmol/L (8 milligrammes/dL). The study revealed that the levels of HDL cholesterol, apolipoprotein A1, apolipoprotein B, and lipoprotein(a) remained unaffected by whether the participants were fasting or non-fasting.
Furthermore, the capacity to predict cardiovascular diseases using both nonfasting and fasting concentrations is similar [ 6 , 7 , 12 ]. Fasting lipid testing is recommended if triglyceride levels exceed 440 mg/dL when not fasting [ 7 , 16 ].
The American Heart Association’s (ACC/AHA) recommendations do not call for fasting to estimate the risk of atherosclerotic cardiovascular disease [ 17 ]. It is important to remember that performing a fasting lipid profile to evaluate LDL cholesterol levels is recommended. This is especially important for individuals with non-HDL cholesterol levels below 5.7 millimol/L (220 milligrams/dL) or triglyceride levels above 5.7 millimol/L (500 milligrams/dL). These lipid profiles can be used as possible indicators for inherited and secondary factors contributing to hypertrophy [ 7 ]. This study sought to consolidate the results of previous smaller studies into a comprehensive meta-analysis. The goal of this study was to investigate the potential impact of fasting, nonfasting, or both on lipid profile testing in the general population. This study represents a groundbreaking meta-analysis involving a substantial sample size of 244,665 participants. It aims to shed light on the global controversy surrounding this subject.
Resources and procedures
The current systematic review is reported under the guidelines set by the Preferred Reporting Items for Systematic Reviews and Meta-Analyses (PRISMA) checklist, which is widely recognized as the standard for reporting systematic reviews [ 18 ]. This systematic review’s methodology adheres to the most recent edition of the Cochrane Handbook for Systematic Reviews of Interventions [ 19 ]. Additionally, it has been registered on Prospero with the number CRD42022376871.
Data sources
This study thoroughly searched various online databases, such as Medline (via PubMed), Scopus, Web of Science, Cochrane Library, Virtual Health Library (VHL), and Global Index Medicine (GHL), as well as the references of the included studies. Additionally, the study explored related articles up to May 2024.
This study consists of studies performed from 2000 until now because the contradiction of guidelines for lipid profile testing appears for the first time in this period. Broad search filters were applied to find all the studies by using the following search strategy: (“Lipids” OR (“fatty acids”) OR “Ceroids” OR “Fats” OR “Glycerides” OR “Glycolipids” OR” Lipoproteins” OR “Lipopolysaccharides”) AND (“Fast* “OR” Fasting” OR (“Hunger Strikes”) OR (“Intermittent fasting”) OR (“Time-Restricted Feeding”)) AND (“Postprandial Periods”) OR “non-Fast$” OR” nonFast$” OR” nonfasting “OR (“Postcibal Period”) AND (“Normal population”) OR (“Healthy volunteers”) OR (“Healthy subject”). The search technique used text words and controlled phrases for the normal population’s fasting and nonfasting lipid profiles. The studies were included according to the preferred reporting items for systematic reviews and meta-analyses. (See Appendix 1 ).
Study selection
Inclusion criteria.
Studies satisfying the following criteria were included:
Study design: All clinical trials or observational studies that measured lipid profiles in fasting and postprandial states.
Population: A population of individuals aged between 18 and 75 years who are in good health. Establishing a baseline by accounting for the influence of various diseases eliminated any potential variables that could impact the results of lipid profile testing. Therefore, the specific effects of diet on the lipid profile were isolated and analyzed.
Outcome: Studies reporting demographic and laboratory findings.
Language: Only studies published in international scientific journals and written in English were included.
Studies that had enough information for qualitative and quantitative analyses.
Exclusion criteria
The researchers did not suggest sufficient data.
Assessing lipid profile parameters or comparing the concentrations of different lipid parameters in unhealthy individuals were omitted.
Animal research, posters, duplicate papers, or conference papers were not included.
Screening and study selection
The studies were exported to EndNote X9.1 (Clarivate Analytics, https://clarivate.com/ ) to remove duplicates. Two independent reviewers [HS, AB] screened all records for eligibility. Eligibility screening was performed in two steps: in the first step, titles and abstracts were screened, and in the second step, full-text articles of the selected abstracts were retrieved and assessed for eligibility. Disagreements were resolved by discussion with a third reviewer. The following PRISMA diagram illustrates the search procedure and details of the study selection process in Fig. 2 .

Identification of studies via databases and registers (Lipid Testing)
Data extraction
Data about the patients’ demographic features, past medical history, clinical presentation, laboratory values, therapies, and clinical outcomes were extracted. Two reviewers, working independently, collected the data from a standardized Microsoft Excel spreadsheet. To ensure the accuracy of the retrieved data, an additional reviewer, independent from the previous two, conducted a thorough examination. All instances of disputes were effectively resolved by engaging in thoughtful and constructive debates.
Evaluation of the bias risk of the included studies
The quality of the included studies was assessed using the National Institute of Health (NIH) scale for observational studies.
Assessing risk of bias in individual studies
Two authors (AB and HS) evaluated the reliability of the studies using the National Institutes of Health (NIH) quality assessment tool for various types of research, including observational cohort, case‒control, controlled interventional, and cross-sectional studies [ 20 ]. This instrument comprises a set of 14 inquiries of various aspects, such as sample size, selection process, exposure assessment, and outcome evaluation. Research articles with a score of 9 or more points were classified as having good quality, while those scoring between 5 and 8 points were deemed to have reasonable quality. Articles with scores ranging from 1 to 4 were categorized as having low quality.
Assessing the risk of bias across studies
The results from all the studies were thoroughly scrutinized and compared to assess any potential bias in the evaluated trials. This enabled the researchers to detect and eliminate biased reporting of outcomes. Egger and colleagues found that the reliability of detecting publication bias using the funnel plot method fails when there are fewer than ten pooled studies [ 21 ].
Data synthesis and analysis
Review Manager Software Version 5.3 (Rev-Man 5.3, Copenhagen, The Nordic Cochrane Centre, The Cochrane Collaboration, 2020). Four studies reported the mean and standard deviation [ 5 , 11 , 13 , 14 ]. Another four studies reported the median and range [ 15 , 23 , 24 , 25 ]. For the statistical analysis, the data are presented as the means and standard deviations, so the data were transformed into means and standard deviations according to the methods described by McGrath [ 22 ].
Heterogeneity
The evaluation of heterogeneity involved a visual examination of the forest plots to verify the extent of overlap between the 95% confidence intervals of the pooled estimations. The chi-square test was employed to assess heterogeneity, while the I2 test was used to quantify heterogeneity. The heterogeneity of the outcomes was deemed significant when the P value exceeded 0.1 and 2 was > 50%. Evidence of heterogeneity in the LDL-cholesterol and triglyceride data was observed in the present study. A random-effects model was employed to address this heterogeneity. Additionally, sensitivity analysis, subgrouping analysis, and prediction intervals were calculated to assess the impact of heterogeneity on the study outcomes and determine its magnitude (trivial, moderate, or substantial).
P values less than 0.05 for the overall standardized mean difference (SMD) were considered to indicate statistical significance. UN inconsistency (I2), chi-square (X2), and tau-square tests were used to assess heterogeneity.
Sensitivity analysis
To evaluate the influence of each study on the overall results, a leave-one-out analysis was conducted to address the variability observed in LDL cholesterol levels. In addition, a specific subgroup analysis was performed for TG. A study that significantly deviated from the norm was excluded to assess the collective effect and accommodate potential variations.
Subgrouping analysis
Subgrouping analysis was conducted based on patients’ metabolic status by separating countries into fat-rich and fat-poor meal countries.
Calculation of the 95% prediction interval
The summary meta-analysis estimates M, the two-sided crucial t value t1-0.05/2, k-1, and the standard deviation for the prediction interval (SDPI) are required to construct the 95% prediction interval. With k being the number of papers included in the meta-analysis, DF = k-1 and a probability level of 0.025 are used. The SDPI, also known as the standard deviation of the prediction interval, has the formula SDPI = (τ2 + SE2), where τ2 is the estimated heterogeneity and SE denotes the standard error of the SMD. If the SE was not supplied, its estimated value could be calculated by multiplying the separation between the 95% confidence interval for the SMD by 3.92. The 95% confidence intervals of the bottom and upper boundaries are equal to M t1-0.05/2 and k-1 SDPI, respectively.
Details of the included studies
Eight studies were included, with 244,665 participants matched by age and sex. Seven studies (Cartier et al., 2017 [ 5 ]; Sidhu and Naugler, 2012 [ 11 ]; Yanget al., 2018 [ 13 ]; Langston, 2008 [ 15 ]; and Umakanth and Ibrahim, 2018 [ 24 ]; Liu et al., 2021 [ 25 ]; Szternel et al., 2019 [ 23 ]) reported separate measurements of lipid parameters in fasting and usual diet lifestyles. Schaefer et al., 2001 [ 14 ] reported separate measurements of lipid parameters during fasting and after four hours of a fat-rich meal. All studies that reported different fasting and nonfasting lipid parameter values were included in the meta-analyses for comparison (Table 1 ).
Characteristics of the included studies
Table 2 was constructed to present the data extraction. Four cross-sectional studies were identified: Sidhu & Naugler, 2012 [ 11 ]; Langsted et al., 2008 [ 15 ]; Liu et al., 2021 [ 25 ]; Szternel et al., 2019 [ 23 ]; the first study [ 11 ] involved 209,180 subjects representing 46.9% males and 53.1% females with a mean age of 52.8 years (18–74 years) and no available data for those participants; the second study [ 15 ] enrolled 33,391 subjects representing 47% males and 53% females with a mean age of 60 ± 9.5 years and a BMI of 26.5 ± 2.5; the third study [ 25 ] enrolled 499 participants divided into 51.6% males and 49.4% females with a mean age of 55 ± 13 years; and the fourth study [ 23 ] involved 289 participants distributed into 50.9 males and 49.1 females with a median age of 48 ± 1.36 years. Additionally, three cohort studies were detected: Cartier et al., 2017 [ 5 ]. In this study, individuals with diabetes were compared to a control group. The control arm was chosen for examination and included 1093 subjects, 50.3% male and 42.5% female, with a mean age of 62.5 ± 10 years. The study conducted by Yang et al., 2018 [ 13 ] involved 41,55% male and 45% female participants, with a mean age of 25.6 ± 6.2 years and a BMI of 21.6 ± 6.2 years. Umakathand Ibrahim 2018 [ 24 ] included 84 participants; 64.28% were male, and 35.71% were female aged 25 to 60. Finally, the RCT by Schaefer et al. 2001 [ 14 ] (this study compares CVs to controls; only the control group was chosen for the study) included 88 subjects, 85% male and 15% female, with a mean age of 62 ± 8.6 years and BMI of 26.2 ± 4.2 years.
Quality assessment
The quality of the included studies was assessed using the NIH scale. Six studies scored 9, 10, 11, 11, 12, and 10; Schaefer et al., 2001 [ 14 ], Langsted, 2008 [ 15 ], Yang et al., 2018 [ 13 ], Sidhu and Naugler 2012 [ 11 ], Liu et al., 2021 [ 25 ] and Szternel et al., 2019 [ 23 ], respectively, and were considered high-quality, while two studies, Cartier et al., 2017 [ 5 ] and Umakanth and Ibrahim, 2018 [ 24 ], were targeted (score 8) with fair quality (Table 3 ).
A funnel plot is not accurate for the assessment of publication bias in this study (fewer than ten studies), so Egger’s regression was utilized, revealing significance for publication bias ( P < 0.001). Subsequently, publication bias was assessed using Egger’s equation. Based on the refilled and trimmed number of studies in Table 4 , a renewed search across databases was conducted to identify an additional two studies—Liu (2021) [ 25 ] and Szternel (2019) [ 23 ]—to conceal publication bias across the studies (Fig. 3 ; Table 4 ).

Funnel plot for publication bias
Differences in fasting and nonfasting cholesterol and high-density cholesterol
As depicted in Figs. 4 and 5 , the estimated mean differences in cholesterol and high-density lipoprotein levels between fasting and nonfasting patients were − 0.03 − 0.02 and − 0.06 − 0.05, respectively. The overall impact of both metrics was significant ( P < 0.00001). The Z values were 9.93 and 20.05 for cholesterol and high-density lipoprotein, respectively. The X2 values were 7.45 ( P = 0.38) and 9.29 ( p = 0.23) for testing heterogeneity, respectively. The I2 statistics for cholesterol levels, fasting and nonfasting lipoprotein levels, and high-density lipoprotein levels were I2 = 6 and I2 = 25%, respectively; therefore, a fixed-effects model was employed due to the homogeneity observed in the included studies.

Forest plot of cholesterol

Forest plot of HDL- cholesterol
Fasting and nonfasting triglyceride levels and low-density cholesterol differences
As shown in Figs. 6 and 7 , the estimation mean differences in triglycerides and low-density lipoprotein levels between fasting and nonfasting patients were 0.38 (95% CI, 0.44) and − 0.06 (95% CI, -0.09), respectively. For both metrics, the test for the total effect was significant ( P < 0. 00001), and the Z values were 13.04 and 3.92 for triglycerides and low-density lipoproteins, respectively. For testing heterogeneity, the X2 values were 102.4 ( P < 0.00001) and 24.4 ( P = 0.001). The I2 statistics for TG levels, fasting and nonfasting lipoprotein levels, and low-density lipoprotein levels were I2 = 93 and I2 = 71%, respectively. A random-effects model was utilized due to the significant heterogeneity observed in the included studies. Sensitivity and subgrouping analyses were conducted, and the prediction intervals were discussed.

Forest plot of triglycerides

Forest plot of LDL- cholesterol
Sensitivity analysis for LDL-chol
A random-effects model was employed due to significant heterogeneity in the included studies, and a sensitivity analysis for LDL-C was also conducted. Leaving out Cartier, 2017 [ 5 ] resolved the heterogeneity in Appendix 2 .
By excluding one study from each scenario, heterogeneity was not resolved, so the subgrouping analysis was conducted based on patients’ metabolic status by separating countries into fat-rich meal and fat-poor meal countries (Appendix 3 ). The subgroup analysis resolved heterogeneity (X2 = 0.57, P = 0.45, I2 = 0%). Additionally, prediction intervals were discussed.
The characteristics of the included studies, including the study design, participant demographics, and quality assessment scores, were detailed. Most of the studies were of high quality, as indicated by their NIH scores. However, two studies were rated as being of fair quality, emphasizing the need to interpret their results carefully.
The analysis revealed significant differences in cholesterol and high-density lipoprotein levels between fasting and nonfasting states, as evidenced by estimated mean differences and corresponding confidence intervals. Heterogeneity testing and model selection were conducted based on the I2 statistics, with a fixed-effect model utilized for homogenous data and a random-effect model for heterogeneous data.
Regarding cholesterol, a significant difference between fasting and nonfasting levels could be seen in the forest plot (Fig. 4 ). The overall SMD was − 0.03, and the 95% confidence interval (CI) was (-0.03, -0.02), with a P value < 0.00001. Regarding heterogeneity, I2 = 6%, and I2 is the percentage of observed variance that reflects actual effect size variations instead of sampling error. The findings align with studies with larger sample sizes: Sidhu and Naugler., 2012 [ 11 ]; Langsted., 2008 [ 15 ] and Liu et al., 2021 [ 25 ]. A large sample size is crucial for minimizing the standard deviation around the mean and, as a result, reducing error. These findings align with previous studies showing the superiority of larger sample sizes over smaller ones. These studies include Cartier et al., 2017 [ 5 ], Yang et al., 2018 [ 13 ], Schaefer et al., 2001 [ 14 ], Umakanth and Ibrahim., 2018 [ 24 ] and Szternel et al., 2019 [ 23 ].
In addition, the forest plot revealed a notable disparity in HDL levels between individuals who fasted and those who did not. The overall standardized mean difference is -0.06, with a 95% confidence interval of (-0.06, -0.05) and a P value of less than 0.00001. Regarding heterogeneity, an I2 value of 42% and a P value of less than 0.12 suggested that a relatively small proportion of the overall observed effect size variance was true. This study aligns with the findings of several previous researchers, such as Sidhu and Naugler, 2012 [ 11 ]; Langsted., 2008 [ 15 ]; Liu et al., 2021 [ 25 ]; and Szternel et al., 2019 [ 23 ], and disagrees with Cartier et al., 2017 [ 5 ]; Yang et al., 2018 [ 13 ]; Schaefer et al., 2001 [ 14 ]; and Umakanth and Ibrahim., 2018 [ 24 ].
The forest plot also revealed a statistically significant difference in triglyceride levels between fasting and nonfasting patients. The overall SMD was 0.38, the 95% CI was 0.33, 0.44, and the Z value of the overall effect was 13.04, with a P value < 0.00001. That is, fasting was significantly different from nonfasting. According to the prediction intervals, triglyceride levels ranged from 0.25 to 1.21; this study expected most levels (moderate effect) to coincide with the respective CIs of overall effect (0.28, 0.41), trivial levels with a range of 0.25 to 0.28 and substantial accurate effect levels with a range of 0.41 to 1.21. Both the PI and overall CI of triglycerides were on the same positive side as the null, i.e., fasting was significantly different from nonfasting in the present study and future studies. All studies’ point estimates and 95% CIs were in the positive direction of the null line, except for Yang et al., 2018 [ 13 ]. In the Schaefer et al., 2001 [ 15 ] study, the SMD was within the overall range, but few values within the 95% confidence intervals (CIs) indicated a substantial actual effect of the PI. According to Cartier et al., 2017 [ 5 ], the SMD and its 95% CI had a trivial effect on the PI. In Langsted, 2008 [ 15 ], Umakanth and Ibrahim 2018 [ 24 ], Liu et al., 2021 [ 25 ] and Szternel et al., 2019 [ 23 ], the SMD and its 95% CI were found to have substantial effects on the PI. In Yang et al. [ 13 ]. , although the 95% CI crossed the null line in the negative direction, its point estimate value was within the trivial effect of the PI.
According to the LDL data analysis, the forest plot showed a significant difference between fasting and nonfasting levels. The overall standardized mean difference was − 0.06 (95% CI (-0.09, -0.03)), and the Z value of the overall effect was 3.92 ( P < 0.0001); i.e., nonfasting significantly differed from fasting ( P < 0.05). In the studies of Cartier et al., 2017 [ 5 ], Sidhu and Naugler, 2012 [ 11 ], Yang et al., 2018 [ 13 ], Schaefer et al., 2001 [ 14 ], Langsted, 2008 [ 15 ], Umakanth and Ibrahim, 2018 [ 24 ] and Liu et al., 2021 [ 25 ], the SMD had a negative effect on the null line, with only 95% CI of Yang et al., 2018 [ 13 ], Schaefer et al., 2001 [ 14 ] and Szternel et al., 2019 [ 23 ], which were in the positive direction of the null line, i.e., a substantial effect of the PI. In the studies of Yang et al., 2018 [ 13 ], Sidhu and Naugler., 2012 [ 11 ], and Langsted, 2008 [ 15 ], the SMD and 95% CI were within the overall moderate effect of the PI. However, Umakanth and Ibrahim, 2018 [ 24 ] showed that the SMD and 95% CI were within the trivial range of the effect of the PI.
Similarly, differences in triglyceride and low-density lipoprotein levels between fasting and nonfasting states were observed, with significant effects demonstrated through estimated mean differences and heterogeneity testing. A random-effects model was employed due to significant heterogeneity among the included studies, necessitating sensitivity and subgrouping analyses to explore potential sources of variation.
Hence, most of the included studies used Friedewald’s equation; logically, TG levels in blood were inversely proportional to LDL-cholesterol levels, and normal levels of serum TG and LDL-cholesterol ranged from 150 to 200 mg/dL and < 135 mg/dL, respectively, because TG, which represents 25%, is not a significant component of LDL-chol, but cholesterol, which represents 75% of LDL-chol. In the fasting state, TG is used for energy production so that the levels of total TG decrease and LDL cholesterol increase. This explains why total TG is on the positive side and LDL-C is on the negative side.
The previous results for all lipid profiles matched and explained according to Kovar and Havel, 2002 [ 26 ], Nakajima et al., 2011 [ 27 ], and Feingold, 2021 [ 28 ], who stated that the appearance of chylomicrons in the blood is followed by a rise in very low-density lipoproteins (VLDLs) due to competition for lipolysis between VLDL and chylomicrons [ 26 , 27 ]. Postprandial lipaemia results from an increase in both intestine-derived chylomicrons and liver-derived VLDL [ 29 ]. Capillary endothelial cells have an enzyme called lipoprotein lipase (LPL) on their luminal surface, which binds to chylomicrons and hydrolyses their triglycerides, releasing free fatty acids (FFAs) that may easily pass into cells and be oxidized for energy or re-esterified for cholesterol ester enrichment [ 30 ]. ApoB48 and ApoE levels are preserved throughout the conversion of chylomicrons to chylomicron remnants. The liver is the primary organ that removes remnants from the blood; receptors for chylomicron remnants recognize ApoE and take up the remnants. Therefore, postprandially, the amount of VLDL tends to increase more than that of chylomicrons [ 27 , 31 ]. After six hours, VLDL is converted to LDL in circulation. Peristalsis helps pump chyme into the small intestine while you eat. They occur during digestion and can persist for two hours after the stomach is emptied. It takes four to five hours for the stomach to empty into the small intestine after a meal [ 27 , 32 ].
The American Heart Association (AHA) guidelines do not recommend a fasting protocol for estimating the risk of atherosclerotic cardiovascular disease. However, the AHA only supposes fasting lipid testing for patients who will undergo statin therapy as well as for patients in whom the non-HDL cholesterol level is less than 5.7 mmol/L (220 mg/dL) or triglycerides are greater than 5.7 mmol/L (500 mg/dL) to avoid the effect of lipemic serum. Nonfasting and fasting results should be complementary but not exclusive because these could be signs of hereditary and/or secondary causes of hypertriglyceridemia [ 7 , 33 ]. According to the findings of Wilson et al. [ 34 ], the identification of potentially actionable abnormal lipid test results, explicitly fasting triglyceride (TG) levels equal to or exceeding 500 mg/dL, necessitates the reporting of such cases as hypertriglyceridemia. Enhancing the proper utilization and accurate documentation of lipid tests is expected to improve their efficacy in the comprehensive care of individuals with a heightened susceptibility to atherosclerotic cardiovascular disease (ASCVD) occurrence. On a laboratory basis, if lipemic serum is detected, fasting for 8–12 h for triglyceride and LDL testing is mandatory; in addition, LDL should be technically measured using diagnostic kits, not Friedewald’s formula. This is because lipaemia affects the calculation of LDL cholesterol, and chylomicrons affect the measurement of triglycerides.
Specifically, sensitivity analysis for low-density lipoprotein cholesterol was performed, and individual studies were excluded to assess their impact on heterogeneity. Subgrouping analysis based on patients’ metabolic status and dietary habits was also conducted to explore sources of heterogeneity further and refine the study’s findings. According to the current statistical data, most lipid measurements, including cholesterol, HDL cholesterol, lipoprotein triglycerides, and LDL, showed significant changes between fasting and nonfasting testing protocols [ 35 ]. .
Strengths and limitations of the study
First, this study identified eight studies involving a large sample size of 244,665 participants, matched by age and sex, and reported separate measurements of lipid parameters under fasting and nonfasting conditions; these studies allowed for a comprehensive analysis of the differences in lipid profiles between fasting and nonfasting states. Second, it is important to note that the smaller trials did not show any variation between fasting and nonfasting patients. However, a larger study with a larger sample size revealed a significant difference, which aligns with the study’s findings. This study has two limitations: a restricted number of included studies due to stringent inclusion and exclusion criteria and significant heterogeneity observed among studies regarding triglycerides and LDL cholesterol.
A meta-analysis of lipid profiles revealed significant differences between fasting and nonfasting states, emphasizing the importance of fasting for consistent results. Fasting status strongly influences cholesterol, HDL, triglyceride, and LDL levels, which are crucial for cardiovascular risk assessment. Clinicians must consider fasting status when interpreting lipid tests, especially in metabolic conditions such as diabetes, to guide therapy effectively. This study underscores the need for fasting-specific lipid testing guidelines for personalized cholesterol therapy and improved cardiovascular risk management.
Data availability
The data in the current paper are publicly available since this is a meta-analysis conducted based on the cited literature.
Abbreviations
Cholesterol
Confidence interval
High-density lipoprotein cholesterol
Inconsistency
Low-density lipoprotein cholesterol
Standard mean difference
Triglycerides
Chi-square test
Jackson KG, Poppitt SD, Minihane AM. Postprandial lipemia and cardiovascular disease risk: interrelationships between dietary, physiological and genetic determinants. Atherosclerosis. 2012;220:22–33.
Article CAS PubMed Google Scholar
Acevedo-Fani A, Singh H. Biophysical insights into modulating lipid digestion in food emulsions. Prog Lipid Res. 2022;85:101129.
Lopez-Miranda J, Williams C, Larion D. Dietary, physiological, genetic and pathological influences on postprandial lipid metabolism. Br J Nutr. 2007;98:458–73.
Vors C, Pineau G, Drai J, Meugnier E, Pesenti S, Laville M, et al. Postprandial endotoxemia linked with chylomicrons and lipopolysaccharides handling in obese versus lean men: a lipid dose-effect trial. J Clin Endocrinol Metab. 2015;100:3427–35.
Cartier LJ, Collins C, Lagacé M, Douville P. Comparison of fasting and non-fasting lipid profiles in a large cohort of patients presenting at a community hospital. Clin Biochem [Internet]. 2018;52:61–6. https://doi.org/10.1016/j.clinbiochem.2017.11.007 .
Mora S. Nonfasting for routine lipid testing from evidence to action. JAMA Intern Med. 2016;176:1005–6.
Article PubMed Google Scholar
Nordestgaard BG, Langsted A, Mora S, Kolovou G, Baum H, Bruckert E, et al. Fasting is not routinely required for determination of a lipid profile: clinical and laboratory implications including flagging at desirable concentration cut-points - a joint consensus statement from the European Atherosclerosis Society and European Fede. Eur Heart J. 2016;37:1944–58.
Article PubMed PubMed Central Google Scholar
Nordestgaard BG, Benn M, Schnohr P, Tybjærg-Hansen A. Nonfasting triglycerides and risk of myocardial infarction, ischemic heart disease, and death in men and women. JAMA. 2007;298:299–308.
Bansal S, Buring JE, Rifai N, Mora S, Sacks FM, Ridker PM. Fasting compared with nonfasting triglycerides and risk of cardiovascular events in women. JAMA. 2007;298:309–16.
Dubois C, Armand M, Azais-Braesco V, et al. Effects of moderate amounts of emulsified dietary fat on postprandial lipemia and lipoproteins in normolipid_emic adults. Am J Clin Nutr. 1994;60:374–82.
Sidhu D, Naugler C. Fasting time and lipid levels in a community-based population: a cross-sectional study. Arch Intern Med. 2012;172:1707–10.
Langsted A, Nordestgaard BG. Nonfasting versus fasting lipid profile for cardiovascular risk prediction. Pathology. 2019;51:131–41.
Yang D, Cai Q, Qi X, Zhou Y. Postprandial lipid concentrations and daytime biological variation of lipids in a healthy Chinese population. Ann Lab Med. 2018;38:431–9.
Schaefer EJ, Audelin MC, McNamara JR, Shah PK, Tayler T, Daly JA, et al. Comparison of fasting and postprandial plasma lipoproteins in subjects with and without coronary heart disease. Am J Cardiol. 2001;88:1129–33.
Langsted A, Freiberg JJ, Nordestgaard BG. Fasting and nonfasting lipid levels influence of normal food intake on lipids, lipoproteins, apolipoproteins, and cardiovascular risk prediction. Circulation. 2008;118:2047–56.
Dyce E. Non-fasting versus fasting cholesterol measurement. Nurse Pract. 2018;43:16–20.
Mirbolouk M, Blaha MJ. ACC/AHA lipid guidelines: personalized care to prevent cardiovascular disease. Cleve Clin J Med. 2020;87:231.
Page MJ, McKenzie JE, Bossuyt PM, Boutron I, Hoffmann TC, Mulrow CD, Shamseer L, Tetzlaff JM, Akl EA, Brennan SE, Chou R, Glanville J, Grimshaw JM, Hróbjartsson A, Lalu MM, Li T, Loder EW, Mayo-Wilson E, McDonald S, McGuinness LA, Stewart LA, Thomas J, Tr MD. The PRISMA 2020 statement: an updated guideline for reporting systematic reviews. BMJ.
Higgins. JP GSC handbook for systematic reviews of interventions: cochrane book series. Cochrane Handb Syst Rev Interv Cochrane B Ser. 2008.
National Heart, Lung and BI. Study Quality Assessment Tools | National Heart, Lung, and Blood Institute (NHLBI). Natl Institutes Heal US Dep Heal Hum Serv. 2018.
Egger M, Smith GD, Schneider M, Minder C. Bias in meta-analysis detected by a simple, graphical test. Br Med J. 1997;315:629–34.
Article CAS Google Scholar
McGrath S, Sohn H, Steele R, Benedetti A. Meta-analysis of the difference of medians. Biometrical J. 2020;62:69–98.
Article Google Scholar
Szternel L, Krintus M, Bergmann K, Derezinski T, Sypniewska G. Non-fasting lipid profile determination in presumably healthy children: impact on the assessment of lipid abnormalities. PLoS ONE. 2018;13:e0198433.
Umakanth M, Ibrahim M. Fasting and non-fasting lipid Profile among Health Care Workers at Teaching Hospital Batticaloa SriLanka. J Biosci Med. 2018;06:15–22.
CAS Google Scholar
Liu M-M, Peng J, Cao Y-X, Guo Y-L, Wu N-Q, Zhu C-G et al. The difference between fasting and non-fasting lipid measurements is not related to statin treatment. Ann Transl Med. 2021;9.
Kovar J, Havel RJ. Sources and properties of triglyceride-rich lipoproteins containing apoB-48 and apoB-100 in postprandial blood plasma of patients with primary combined hyperlipidemia. J Lipid Res. 2002;43:1026–34.
Nakajima K, Nakano T, Tokita Y, Nagamine T, Inazu A, Kobayashi J, et al. Postprandial lipoprotein metabolism: VLDL vs chylomicrons. Clin Chim Acta. 2011;412:1306–18.
Article CAS PubMed PubMed Central Google Scholar
Feingold KR. Lipid and lipoprotein metabolism. Endocrinol Metab Clin. 2022;51:437–58.
Stahel P, Xiao C, Nahmias A, Lewis GF. Role of the gut in diabetic dyslipidemia. Front Endocrinol (Lausanne). 2020;11:116.
Kumari A, Kristensen KK, Ploug M, Winther A-ML. The importance of lipoprotein lipase regulation in atherosclerosis. Biomedicines. 2021;9:782.
Gugliucci A. Triglyceride-Rich Lipoprotein metabolism: key regulators of their flux. J Clin Med. 2023;12:4399.
Goyal RK, Guo Y, Mashimo H. Advances in the physiology of gastric emptying. Neurogastroenterol Motil. 2019;31:e13546.
Farukhi Z, Mora S. Assessing the dyslipidemias: to fast or not to fast? Curr Opin Endocrinol Diabetes Obes. 2021;28:97.
Wilson PWF, Jacobson TA, Martin SS, Jackson EJ, Le N-A, Davidson MH, et al. Lipid measurements in the management of cardiovascular diseases: practical recommendations a scientific statement from the national lipid association writing group. J Clin Lipidol. 2021;15:629–48.
Tada H, Nomura A, Yoshimura K, Itoh H, Komuro I, Yamagishi M, et al. Fasting and non-fasting triglycerides and risk of cardiovascular events in diabetic patients under statin therapy. Circ J. 2020;84:509–15.
Download references
Open access funding provided by The Science, Technology & Innovation Funding Authority (STDF) in cooperation with The Egyptian Knowledge Bank (EKB). The current work has not received any form of financing from any institution or funding body.
Open access funding provided by The Science, Technology & Innovation Funding Authority (STDF) in cooperation with The Egyptian Knowledge Bank (EKB).
Author information
Authors and affiliations.
Department of Clinical Pathology, National Liver Institute, Menoufia University, Shibin Elkom, 32511, Egypt
Mona G El-Abd & Sara A. Saied
Department of Clinical Microbiology, National Liver Institute, Menoufia University, Shibin Elkom, 32511, Egypt
Samah M. Awad
Department of Hepatology and Gastroenterology, National Liver Institute, Menoufia University, Shibin Elkom, 32511, Egypt
Shimaa K. Almahdy
Ministry of Tourism and Antiquities, Aswan Office, Aswan, 81511, Egypt
AbdulRahman A Saied
Department of Microbiology, Animal Health Research Institute, Shibin Elkom, 32511, Egypt
Helmy S. Saleh
Department of Clinical Pathology, National Liver Institute Hospital, Menoufia Univerisity, Shebin Elkoom, Egypt
Ahmed B. Zaid, Alshimaa M. Elmalawany & Hind S. AboShabaan
You can also search for this author in PubMed Google Scholar
Contributions
Conceptualisation, ABZ and HSS; Methodology, all authors; Validation, ABZ, AME, and SKA; Software, ABZ, MGE, and SMA; Formal analysis, ABZ, SAS, and HSS; Resources, all authors; Data curation, ABZ, AME, and MGE; Writing-original draft preparation, all authors; Visualisation, SKA and SMA; Supervision, HSS. All authors have read and approved the final version of the manuscript.
Corresponding authors
Correspondence to Ahmed B. Zaid or AbdulRahman A Saied .
Ethics declarations
Ethical approval.
Not applicable.
Consent for publication
Competing interests.
The authors declare no competing interests.
Systematic review registration
PROSPERO CRD42022376871.
Additional information
Publisher’s note.
Springer Nature remains neutral with regard to jurisdictional claims in published maps and institutional affiliations.
Electronic supplementary material
Below is the link to the electronic supplementary material.
Supplementary Material 1
Supplementary material 2, supplementary material 3.

Supplementary Material 4
Supplementary material 5.

Supplementary Material 6
Supplementary material 7, rights and permissions.
Open Access This article is licensed under a Creative Commons Attribution 4.0 International License, which permits use, sharing, adaptation, distribution and reproduction in any medium or format, as long as you give appropriate credit to the original author(s) and the source, provide a link to the Creative Commons licence, and indicate if changes were made. The images or other third party material in this article are included in the article’s Creative Commons licence, unless indicated otherwise in a credit line to the material. If material is not included in the article’s Creative Commons licence and your intended use is not permitted by statutory regulation or exceeds the permitted use, you will need to obtain permission directly from the copyright holder. To view a copy of this licence, visit http://creativecommons.org/licenses/by/4.0/ . The Creative Commons Public Domain Dedication waiver ( http://creativecommons.org/publicdomain/zero/1.0/ ) applies to the data made available in this article, unless otherwise stated in a credit line to the data.
Reprints and permissions
About this article
Cite this article.
Zaid, A.B., Awad, S.M., El-Abd, M.G. et al. Unraveling the controversy between fasting and nonfasting lipid testing in a normal population: a systematic review and meta-analysis of 244,665 participants. Lipids Health Dis 23 , 199 (2024). https://doi.org/10.1186/s12944-024-02169-y
Download citation
Received : 22 February 2024
Accepted : 29 May 2024
Published : 27 June 2024
DOI : https://doi.org/10.1186/s12944-024-02169-y
Share this article
Anyone you share the following link with will be able to read this content:
Sorry, a shareable link is not currently available for this article.
Provided by the Springer Nature SharedIt content-sharing initiative
- Lipid profile testing
- Healthy population
Lipids in Health and Disease
ISSN: 1476-511X
- General enquiries: [email protected]
IMAGES
VIDEO
COMMENTS
The purpose of systematic literature reviews is simple. Essentially, it is to provide a high-level of a particular research question. This question, in and of itself, is highly focused to match the review of the literature related to the topic at hand. For example, a focused question related to medical or clinical outcomes.
A literature review is a type of review that uses a less systematic and formal approach than a systematic review. Typically, an expert in a topic will qualitatively summarize and evaluate previous work, without using a formal, explicit method.
Systematic review methods have influenced many other review types, including the traditional literature review. Covidence is a web-based tool that saves you time at the screening, selection, data extraction and quality assessment stages of your systematic review. It supports easy collaboration across teams and provides a clear overview of task ...
This article aims to provide an overview of the structure, form and content of systematic reviews. It focuses in particular on the literature searching component, and covers systematic database searching techniques, searching for grey literature and the importance of librarian involvement in the search. It also covers systematic review reporting standards such as PRISMA-P and PRISMA, critical ...
A systematic review, however, is a comprehensive literature review conducted to answer a specific research question. Authors of a systematic review aim to find, code, appraise, and synthesize all of the previous research on their question in an unbiased and well-documented manner.
Systematic Review vs. Literature Review. It is common to confuse systematic and literature reviews as both are used to provide a summary of the existent literature or research on a specific topic. Even with this common ground, both types vary significantly. Please review the following chart (and its corresponding poster linked below) for the ...
A systematic review follows explicit methodology to answer a well-defined research question by searching the literature comprehensively, evaluating the quantity and quality of research evidence rigorously, and analyzing the evidence to synthesize an answer to the research question. The evidence gathered in systematic reviews can be qualitative ...
A systematic review collects all possible studies related to a given topic and design, and reviews and analyzes their results [ 1 ]. During the systematic review process, the quality of studies is evaluated, and a statistical meta-analysis of the study results is conducted on the basis of their quality. A meta-analysis is a valid, objective ...
This guide explains the principles of systematic reviews and offers advice on getting started with your systematic literature search.
It's common to confuse systematic and literature reviews because both are used to provide a summary of the existent literature or research on a specific topic. Regardless of this commonality, both types of review vary significantly. The following table provides a detailed explanation as well as the differences between systematic and literature reviews.
A common type of submission at any Journal is a review of the published information related to a topic. These are often returned to their authors without review, usually because they are literature reviews rather than systematic reviews.
This research guide will help you research, compile, and understand the elements required for a literature review. Systematic reviews and literature reviews are commonly confused. The main difference between the two is that systematic reviews answer a focused question whereas literature reviews contextualize a topic.
Most budding researchers are confused between systematic review vs. literature review. In this article, we explain what a systematic literature review is, how to differentiate and choose from systematic review vs literature review and tips for authors when conducting a review.
Both systematic and literature (or comprehensive) reviews are a gathering of available information on a certain subject. The difference comes in the depth of the research and the reporting of the conclusions. Let's take a look. A literature or comprehensive review brings together information on a topic in order to provide an overview of the ...
A literature review is a systematic way of collecting and synthesizing previous research ( Snyder, 2019 ). An integrative literature review provides an integration of the current state of knowledge as a way of generating new knowledge ( Holton, 2002 ). HRDR is labeling Integrative Literature Review as one of the journal's four non-empirical research article types as in theory and conceptual ...
What's in a name? The difference between a Systematic Review and a Literature Review, and why it matters.
For those not immersed in systematic reviews, understanding the difference between a systematic review and a systematic literature review can be confusing. It helps to realise that a "systematic review" is a clearly defined thing, but ambiguity creeps in around the phrase "systematic literature review" because people can and do use it in a variety of ways.
Literature reviews don't usually apply the same rigour in their methods. That's because, unlike systematic reviews, they don't aim to produce an answer to a clinical question. Literature reviews can provide context or background information for a new piece of research. They can also stand alone as a general guide to what is already known about a particular topic.
Systematic reviews are overviews of the literature undertaken by identifying, critically appraising and synthesising results of primary research studies using an explicit, methodological approach (3). They aim to summarise the best available evidence on a particular research topic.
Literature review and systematic review are two scholarly texts that help to introduce new knowledge to various fields. A literature review, which reviews the existing research and information on a selected study area, is a crucial element of a research study. A systematic review is also a type of a literature review.
There are many types of reviews of the medical and public health evidence, each with its own benefits and challenges. In this blog post, we detail five key differences between a systematic review and other types of reviews, including narrative and comprehensive reviews.
A systematic review is an article that synthesizes available evidence on a certain topic utilizing a specific research question, pre-specified eligibility criteria for including articles, and a systematic method for its production. Whereas a meta-analysis is a quantitative, epidemiological study design used to assess the results of articles ...
Some large-scale literature reviews (sometimes called meta-analytic reviews, integrative reviews, or systematic reviews) use a large body of existing research to answer a pressing question in a field or to make an evidence-based recommendation. CONCERNS TO ADDRESS in a literature review often start with the questions below. Keep in
The major differences between a systematic review and a narrative review lie in their objectives, methodology, and application areas.
If you work on a systematic review team or plan to, you'll want to know three important things: the essential features and purpose of a systematic review, how systematic reviews differ from scoping reviews, rapid reviews, informal reviews and other review types, and how to determine if a systematic review on a topic is needed.
A systematic literature review (SLR) was conducted according to the Preferred Reporting Items for Systematic Reviews (PRISMA) guidelines and adhered to the principles outlined in the Cochrane Handbook for Systematic Reviews of Interventions, Centre for Reviews and Dissemination's Guidance for Undertaking Reviews in Healthcare, and Methods for ...
The current systematic review is reported under the guidelines set by the Preferred Reporting Items for Systematic Reviews and Meta-Analyses (PRISMA) checklist, which is widely recognized as the standard for reporting systematic reviews . This systematic review's methodology adheres to the most recent edition of the Cochrane Handbook for ...
This preregistered systematic literature review describes these constructs and provides a framework for cultural tailoring with evidence from a review of 63 studies, published from 2010 to 2020, to characterize the processes, elements, and theories used in the existing literature.
The purpose of this systematic literature review is to identify trends in Green HRM research related to sustainability over the past decade and to determine how green human research management (GHR...
This literature review presents how Chinese international graduate students face challenges in the US due to sociocultural, ideological, and educational differences. This systematic literature review explores these students' critical thinking skills, which are crucial factors for academic success but have been underexplored.