Citation Searching This link opens in a new window
When to stop searching
Citation Management
Annotating Articles Tip
5. Critically analyze and evaluate
How to Review the Literature
Using a Synthesis Matrix
7. Write literature review
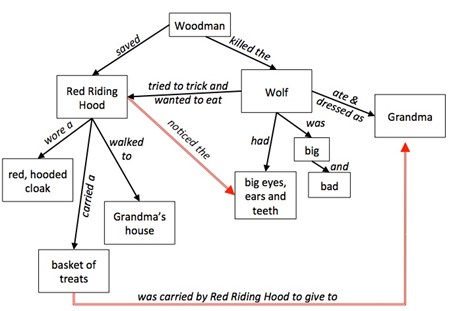
Concept maps or mind maps visually represent relationships of different concepts. In research, they can help you make connections between ideas. You can use them as you are formulating your research question, as you are reading a complex text, and when you are creating a literature review. See the video and examples below.
How to Create a Concept Map
Credit: Penn State Libraries ( CC-BY ) Run Time: 3:13
Bubbl.us Free version allows 3 mind maps, image export, and sharing.
MindMeister Free version allows 3 mind maps, sharing, collaborating, and importing. No image-based exporting.
Mind Map of a Text Example
Credit: Austin Kleon. A map I drew of John Berger’s Ways of Seeing in 2008. Tumblr post. April 14, 2016. http://tumblr.austinkleon.com/post/142802684061#notes
Literature Review Mind Map Example
This example shows the different aspects of the author's literature review with citations to scholars who have written about those aspects.
Credit: Clancy Ratliff, Dissertation: Literature Review. Culturecat: Rhetoric and Feminism [blog]. 2 October 2005. http://culturecat.net/node/955 .
Concept Maps are a way to graphically represent ideas and how they relate to each other.
Concept maps may be simple designs illustrating a central theme and a few associated topics or complex structures that delineate hierarchical or multiple relationships.
J.D. Novak developed concept maps in the 1970's to help facilitate the research process for his students. Novak found that visually representing thoughts helped students freely associate ideas without being blocked or intimidated by recording them in a traditional written format.
Concept mapping involves defining a topic; adding related topics; and linking related ideas
Use Bubbl.us or search for more free mind-mapping tools on the web.
GSlides can create concept maps using their Diagram feature. Insert > Diagram > Hierarchy will give you some editable templates to use.
Tutorial on diagrams in GSlides .
MICROSOFT WORD
MS Word can create concept maps using Insert > SmartArt Graphic. Select Process, Cycle, Hierarchy, or Relationship to see templates.
NVivo is software for qualitative analysis that has a concept map feature. Zotero libraries can be uploaded using ris files. NVivo Concept Map information.
A concept map or mind map is a visual representation of knowledge that illustrates relationships between concepts or ideas. It is a tool for organizing and representing information in a hierarchical and interconnected manner. At its core, a concept map consists of nodes, which represent individual concepts or ideas, and links, which depict the relationships between these concepts .
Below is a non-exhaustive list of tools that can facilitate the creation of concept maps.
www.canva.com
Canva is a user-friendly graphic design platform that enables individuals to create visual content quickly and easily. It offers a diverse array of customizable templates, design elements, and tools, making it accessible to users with varying levels of design experience.
Pros: comes with many pre-made concept map templates to get you started
Cons : not all features are available in the free version
Explore Canva concept map templates here .
Note: Although Canva advertises an "education" option, this is for K-12 only and does not apply to university users.
www.lucidchart.com
Lucid has two tools that can create mind maps (what they're called inside Lucid): Lucidchart is the place to build, document, and diagram, and Lucidspark is the place to ideate, connect, and plan.
Lucidchart is a collaborative online diagramming and visualization tool that allows users to create a wide range of diagrams, including flowcharts, org charts, wireframes, and mind maps. Its mind-mapping feature provides a structured framework for brainstorming ideas, organizing thoughts, and visualizing relationships between concepts.
Lucidspark , works as a virtual whiteboard. Here, you can add sticky notes, develop ideas through freehand drawing, and collaborate with your teammates. Has only one template for mind mapping.
Explore Lucid mind map creation here .
How to create mind maps using LucidSpark:
Note: U-M students have access to Lucid through ITS. [ info here ] Choose the "Login w Google" option, use your @umich.edu account, and access should happen automatically.
www.figma.com
Figma is a cloud-based design tool that enables collaborative interface design and prototyping. It's widely used by UI/UX designers to create, prototype, and iterate on digital designs. Figma is the main design tool, and FigJam is their virtual whiteboard:
Figma is a comprehensive design tool that enables designers to create and prototype high-fidelity designs
FigJam focuses on collaboration and brainstorming, providing a virtual whiteboard-like experience, best for concept maps
Explore FigJam concept maps here .
Note: There is a " Figma for Education " version for students that will provide access. Choose the "Login w Google" option, use your @umich.edu account, and access should happen automatically.
www.mindmeister.com
MindMeister is an online mind mapping tool that allows users to visually organize their thoughts, ideas, and information in a structured and hierarchical format. It provides a digital canvas where users can create and manipulate nodes representing concepts or topics, and connect them with lines to show relationships and associations.
Features : collaborative, permits multiple co-authors, and multiple export formats. The free version allows up to 3 mind maps.
Explore MindMeister templates here .
<< Previous: Using Citation Managers
Next: Writing the Review >>
Last Updated: May 9, 2024 11:44 AM
URL: https://guides.lib.umich.edu/litreview
A literature review of open-ended concept maps as a research instrument to study knowledge and learning
Open access
Published: 24 February 2021
Volume 56 , pages 73–107, ( 2022 )
Cite this article
You have full access to this open access article
Kirsten E. de Ries ORCID: orcid.org/0000-0002-6210-5604 1 ,
Harmen Schaap 2 ,
Anne-Marieke M. J. A. P. van Loon 1 ,
Marijke M. H. Kral 1 &
Paulien C. Meijer 2
13k Accesses
16 Citations
6 Altmetric
Explore all metrics
In educational, social or organizational studies, open-ended concept maps are used as an instrument to collect data about and analyze individuals’ conceptual knowledge. Open-ended concept map studies devoted to knowledge and learning apply a variety of methods of analysis. This literature review systematically summarizes the various ways in which open-ended concept maps have been applied in previous studies of knowledge and learning. This paper describes three major aspects of these studies: what methods of analysis were used, what concept map characteristics were considered, and what conclusions about individuals’ knowledge or understanding were drawn. Twenty-five studies that used open-ended concept maps as a research instrument were found eligible for inclusion. In addition, the paper examines associations between the three aspects of the studies and provides guidelines for methodological coherence in the process of such analysis. This review underscores the importance of expatiating on choices made concerning these aspects. The transparency provided by this method of working will contribute to the imitable application of open-ended concept maps as a research tool and foster more informed choices in future open-ended concept map studies.”
Examining grounded theory through the lens of rationalist epistemology
The use of open data as a material for learning
Socially Open-Ended Problems for Enriching Student Learning with Mathematical Models and Social Values
Avoid common mistakes on your manuscript.
1 Introduction
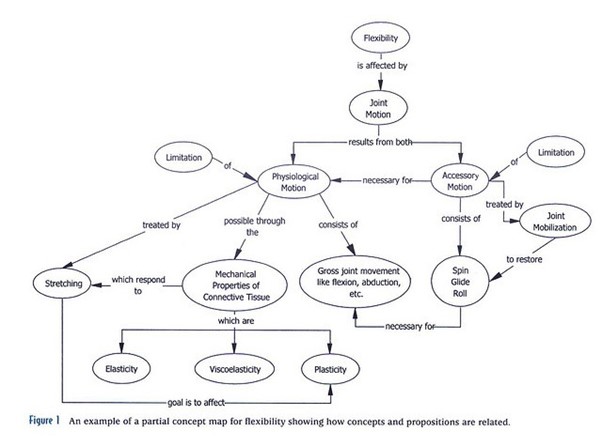
Concept maps were introduced by Novak and Gowin to activate or elaborate (prior) knowledge. “Concept maps are graphical tools for organizing and representing knowledge. They include concepts, usually enclosed in circles or boxes of some type, and relationships between concepts indicated by a connecting line linking two concepts” (Novak and Cañas 2008 , p.1). Concept maps have a wide variety of applications and are an increasingly popular learning and strategy tool (e.g. Novak and Cañas 2008 ; Stevenson, Hartmeyer and Bentsen 2017 ). It is on the rise as an instructional method (e.g. Nair and Narayanasamy 2017 ), to aid in curriculum design (e.g. Buhmann and Kingsbury 2015 ) and as an assessment tool (e.g. Marriott and Torres 2016 ). In recent years, concept maps have been used more widely as a research instrument. This includes the application of concept maps to study knowledge, explore mental models and misconceptions, or to describe people’s opinions. Figure 1 provides an example of a concept map. The focus question or prompt for the example in Fig. 1 could have been “What is a concept map?” or the topic provided could have been ‘Concept maps’.
Example of a hierarchical concept map by Ed Dole (adapted from Dori 2004 )
The words enclosed in circles are concepts, also referred to as nodes. These concepts are connected with arrows, or links, that are indicated with linking words, explaining the relation between the concepts. A proposition is a concept-link-concept combination, for instance ‘concept maps–include—hierarchies’. In this example, there are four hierarchies or strings of concepts stemming from the root concept ‘concept maps’. Links between concepts from the same hierarchy are called links. Links between concepts from different hierarchies are cross-links.
A concept map assignment includes: concepts or nodes, links or linking lines, linking phrases, and the concept map structure, and all these aspects can be either respondent driven or provided by the instructor (Ruiz-Primo 2000 ). For instance respondents think of concepts themselves, or are provided a list of concepts they can use for their concept map. In most studies that apply concept maps, at least one of these four aspects of the task is instructor-directed; most commonly, the concepts to be used are provided (Ruiz-Primo et al. 2001 ). In open-ended concept maps respondents choose their own terms for nodes, links or linking lines, linking phrases and structure, therefore they resemble the respondents’ knowledge structure (Cañas, Novak and Reiska 2013 ; Ruiz-Primo et al. 2001 ). Open-ended concept maps are graphical tools in which respondents are invited to represent their personal construction of knowledge, without instructor-directed aspects. In an open-ended concept map assignment, only a topic or prompt is provided to the respondents. For instance Ifenthaler, Masduki and Seel ( 2011 ) asked respondents to create a concept map to depict their understanding of research skills, Beyerbach ( 1988 ) asked students to draw a concept map for teacher planning and Çakmak ( 2010 ) asked respondents to generate a concept map concerning teacher roles in teaching process.
Open-ended concept maps are commonly applied to explore student knowledge, to evaluate what or how students learn or to explore misconceptions in student knowledge (Greene et al. 2013 ; Stevenson et al. 2017 ). The application of open-ended concept maps to study knowledge and learning faces new challenges concerning application and analysis, as this application transcends the traditional, strictly defined, quantitative use of concept maps in other domains, such as engineering, mathematics and psychology (Wheeldon and Faubert 2009 ). When exploring knowledge and learning, the strictly defined quantitative use of concept maps is believed not to do justice to the personal and idiosyncratic nature of people’s understanding (Novak 1990 ). Open-ended concept maps are therefore used to study people’s knowledge and understanding of complex phenomena, such as leadership or inclusive education. They are also used when respondents’ knowledge is expected to be fragmented, or when the misconceptions and/or limited nature of people’s understanding are part of the study (Greene et al. 2013 ; Kinchin, Hay and Adams 2000 ).
The variation in outcomes using open-ended concept maps as a research instrument reduces the comparability and leads to difficulty in data analysis (Watson et al. 2016a ; Yin et al. 2005 ). Previous studies describe limitations concerning methods of analysis. Several studies argue that quantitative analysis neglects the quality or meaning and learning (Bressington, Wells and Graham 2011 ; Buhmann and Kingsbury 2015 ; Kinchin et al. 2000 ). Others argue that it is an insufficient evaluation of values or perceptions as expressed by respondents (Jirásek et al. 2016 ). Some studies address contradicting outcomes when methods of analysis are compared, and they question the validity and reliability of concept map analysis and concept maps as a research instrument (Ifenthaler et al. 2011 ; Kinchin 2016 ; Watson et al. 2016a ; West et al. 2002 ). Cetin, Guler and Sarica ( 2016 ) claim that it is unclear how the reliability and validity of open-ended concept map analysis can be determined. Additionally, Ifenthaler et al. ( 2011 ) argue that some of the methods of analysis applied in previous studies have questionable reliability and validity. Tan, Erdimez and Zimmerman ( 2017 ) complement these statements by addressing the lack of clarity they perceived in the existing methods of analysis when choosing a method of analysis for their study.
This literature review explores the analysis of open-ended concept maps in previous studies. Firstly, we contemplate what aspects of the process of analysis to consider for this review, based on the quality appraisal of the process of analysis in qualitative research. Creswell ( 2012 ) emphasizes the interrelation of the steps concerning data gathering, interpretation and analysis in qualitative research. Accordingly, Huberman and Miles ( 2002 ) proposed three central validities for assessing the quality of qualitative research: descriptive, interpretative and theoretical. These are respectively concerned with the data collected or the characteristics of the data that are considered, how data are interpreted or analyzed, and the conclusions that are drawn. These three aspects should be aligned or coherent to increase the quality of research, and are therefore explored in previous open-ended concept map studies. The method of analysis applied, concept map characteristics measured, and conclusions drawn, and the associations between these aspects are explored (Chenail, Duffy, George and Wulff 2011 ; Coombs 2017 ). The research question is: Which methods of analysis are applied to open-ended concept maps when studying knowledge and learning, and how are these associated with concept map characteristics considered and conclusions drawn?
To answer the research question, we extract information concerning method of analysis applied, concept map characteristics measured, and conclusions drawn from previous open-ended concept map studies. Following guidelines for critical interpretative synthesis reviews, this review combines an aggregative and interpretative approach to critically understand the analysis in previous studies (Gough and Thomas 2012 ). The aggregation entails the representation of clusters for each aspect based on cross-case analysis, as presented in the results. Subsequently, patterns among these aspects are explored and interpreted, leading to considerations for future studies concerning these three aspects and their methodological coherence.
2.1 Selecting articles (inclusion)
This review applies a comprehensive search strategy to include all relevant studies (Verhage and Boels 2017 ). Scientific articles are selected from three databases: the Education Resources Information Center (ERIC); PsycINFO; and the Web of Science (WOS). The keywords for the search are ‘concept map’, and ‘analysis’ or ‘assessment’ or ‘scoring’. Studies are included from 1984 onward, when Novak and Gowin established the term ‘concept map.’ Due to the broad social science disciplines included in WOS, a further selection is made based on the predetermined WOS Category ‘Education educational research’, to exclude for instance geographical studies that map cities, and are not concerned with knowledge or learning but spatial planning. The combined search yields 451 studies in ERIC, 198 studies in PsycINFO and 498 studies in WOS.
Three reviews of concept maps studies are used in a selective search strategy: the open-ended concept map studies described in these reviews are included in this study (Anohina and Grundspenkis 2009 ; Ruiz-Primo and Shavelson 1996 ; Strautmane 2012 ). Based on the snowballing technique with these reviews, 85 additional studies are included, and 1316 in total, as depicted in Fig. 2 . The first review by Anohina and Grundspenkis ( 2009 ) presented manual methods of analysis, and addressed the feasibility of automating these methods. The reviews by Ruiz-Primo and Shavelson ( 1996 ) and Strautmane ( 2012 ) related methods of analysis to the openness of the concept mapping assignments. These reviews did not explore the associations between the methods of analysis and the conclusions drawn in these studies. Our review is one of the first to address the associations between the methods of analysis, the concept map characteristics considered and the conclusions drawn, instead of focusing on these aspects separately. This coherence is relevant to explore as it enhances the rigor and quality of qualitative studies, by ensuring an appropriate alignment of these aspects within studies (Davis 2012 ; Poucher et al. 2020 ).
Search and selection strategy
2.2 Screening articles (exclusion)
The selected articles are screened. 254 duplicates are excluded. Next titles and abstracts are screened. In order to increase the quality of this process, the inclusion and exclusion criteria are discussed with co-researchers until consensus is reached. 703 articles did not apply concept maps, or concept maps were used as learning tool, instructional tool, for curriculum design or to analyze answers, texts or interviews. These are excluded. For the remaining 359 studies that apply concept maps as research instrument, step 2 of the screening is based on the methods section. Studies are included based on the following inclusion criteria:
Concept maps were used as a research instrument;
The study was an empirical study;
Respondents made their own concept map; and
An open-ended concept map assignment was applied.
In seven studies, other visual drawings than concept maps were used. In 31 studies, concept map analysis was described based on theory instead of empirical data. In 71 studies, concepts map were constructed by the researcher based on interviews, together with the respondent during an interview or at group level based on card sorting techniques. In 154 studies, at least one of the aspects of the concept mapping task was instructor-directed. Studies are included if one or more focus questions or one central concept was provided.
The critical appraisal of the methods section, leads to two additional exclusion criteria (Verhage and Boels 2017 ). Seventy studies applied another research instrument alongside concept maps. For these studies, the results sections are read to discover whether concept maps were evaluated separately. In 30 studies, concept map analysis was combined with interviews or reflective notes. 36 studies compared concept map scores with results from other research instruments, such as knowledge tests or interviews. These studies were excluded because the method of analysis or conclusions for the concept maps was not described separately. This is problematic for our research purposes, as this study is concerned with concept map analysis and conclusions based on concept maps analysis, and not analysis and conclusions based on other instruments. Four studies that applied two instruments—but reported on the analysis of concept maps separately—are included.
For step 3 of the selection process, the full texts of the remaining 30 studies are read. Five studies are excluded; in two studies, different concept map characteristics are summed up and not described separately. One study calculated correlations between different concept map characteristics, and two studies drew conclusions purely on group level, resulting in 25 studies being included in this review, as depicted in Fig. 2 .
2.3 Data selection from articles
Information on the following topics is extracted from the articles: the method of analysis, the concept map characteristics, the conclusions, the rationale behind the choices made, and general or descriptive information. A data selection scheme is developed which depicts the extracted information (Table 1 ). To increase the reliability of the data selection, this scheme was continuously discussed and adjusted by the authors over the entire selection process. Reliability was further ensured by using signal words, based on common terms used in the studies. For three of the studies included, the data selection was performed independently by two researchers. Both researchers selected statements from the articles concerning the items described in Table 1 . One researcher included 79 statements and the other 94 statements. The statements selected by the researchers overlapped completely. The 15 statements only selected by one researcher were discussed and added to the data. A total of 109 citations were extracted from these three studies.
2.4 Data analysis
Data analysis is performed by using the selected articles for within- and cross-case analysis (Miles and Huberman 1994 ). In this review, the cases are the articles included. The first step of analysis is to order the extracted information in a meta-matrix (see " Appendix A ") that presents all relevant condensed data for each case or article separately (Miles and Huberman 1994 ). If no explicit statements are found, information is added by using the within-case analytic strategy of ‘overreading’ (Ayres, Kavanaugh and Knafl 2003 ). For instance, for a study that counted specific concept map characteristics but did not describe the method of analysis any further, the method of analysis was described as quantitative analysis. To prepare data for cross-case analysis, different labels for the same aspect are unified. For instance, ‘counting nodes’ is relabeled as ‘number of nodes.’
The second step entails coding the selected statements concerning the research object, research design, methods of analysis, concept map characteristics, and conclusions drawn in the articles, using a cross-case analysis approach. Preliminary coding of statements concerning methods of analysis is based on the way studies refer to their method of analysis. However, the same term was sometimes used to refer to more than one analysis method, while in other cases, multiple terms were used to refer to a single method. Thus, the designation of clusters based on how the studies referred to their methods of analysis proved inconclusive and ambiguous.
Different distinctions between methods of analysis are found in the literature. For example, in the review by Anohina and Grundspenkis ( 2009 ) the use of an expert’s map is one choice, as well as the choice for quantitative or qualitative analysis and structural or relational analysis, to make a distinction between methods of analysis. In the review by Strautmane ( 2012 ), the criteria for similarity analysis, e.g. “proposition similarity to expert’s CM”, or “convergence with expert’s CM”, are described as separate criteria. Also in the review by Ruiz-Primo and Shavelson ( 1996 ), comparison with a criterion map, is described as a separate method of analysis. In this review, the distinction between quantitative, qualitative, similarity and holistic analysis is chosen, as these methods of analysis consider the concept map characteristics distinctively and they are based on different principles and theoretical assumptions. Holistic analysis is a separate method of analysis, as it is based on a rubric, and similarity is a separate analysis, as it is based on a reference map. Moreover, these four methods of analysis lead to different types of conclusions, and are therefore considered as distinctive ways to analyze and interpret data from concept maps. In conceptual terms, these four methods of analysis are mutually exclusive, as they estimate the concept map characteristics differently. However, when applied to analyze data, they can be combined: similarity analysis compares concept maps to a reference map, either qualitatively or quantitatively.
The statements concerning concept map characteristics are unified; for instance, ‘breadth and depth’ or ‘hierarchical structure of the map’ were both coded as structural complexity. All concept map characteristics related to the semantic content of the map, referred to as ‘terms used’, ‘content comprehensiveness’, ‘correctness’ or ‘sophistication’, are clustered as semantic sophistication. The conclusions are clustered in the same way as the methods of analysis. Conclusions about numbers of concept map characteristics are labelled as quantitative, conclusions about descriptions are labelled as qualitative, conclusions about overlap with a reference map are labeled as similarity and conclusions about the quality of the map as a whole are labelled as holistic.
For the same three studies that two researchers selected statements from independently, the statements were coded by two researchers independently. A total of 109 statements were coded. Krippendorf’s alpha of the inter-rater agreement was 0.91. The discrepancies in coding were all related to concept map characteristics. For instance, counting cross-links was coded as interlinkage by one researcher and as structural complexity by the other researcher, while the validity of links was labeled as semantic sophistication by one researcher and category representation by the other. The first author coded the data from the remaining 22 articles included in the review and consulted the co-authors when in doubt.
The third step of the analysis was exploring the associations between the methods of analysis, concept map characteristics and conclusions drawn. Across all articles, the associations between the choices made in these three areas were explored. For instance, for all studies that applied quantitative analysis, the concept map characteristics considered were explored and listed. This showed that quantitative analysis was concerned with specific concept map characteristics, e.g. size, structural complexity, category representation, interlinkage or complexity index. Subsequently, the conclusions drawn were explored for each combination of methods of analysis and concept map characteristics considered. Based on the associations found across articles between the methods of analysis applied, the concept map characteristics considered and the conclusions drawn, considerations for methodological coherence between these aspects were formulated.
Twenty-five empirical studies from 1988 through 2018 used open-ended concept maps. Twenty-one of these studies consisted of multiple measurements, most commonly a pre-test/post-test design. Four of these studies compared two experimental groups, and two compared an experimental and control group. Two of the four studies that consisted of one measurement compared two experimental groups. In two studies, respondents received their previous concept map to adjust in the post-test, and in one study respondents could choose to adjust their previous map or to start a new one. Concept maps were either made on paper with pen, on sticky notes or on a computer, most commonly with the CMapTool, developed by the Florida Institute for Human and Machine Cognition. " Appendix A " provides the meta-matrix of these studies, including all selected information. For each aspect (method of analysis, concept map characteristics, and conclusions) the categorization or clustering based on the cross-case data analysis is presented in separate paragraphs. How concept map characteristics are associated with methods of analysis is described in the paragraph concerning the concept map characteristic. How conclusions drawn are related to concept map characteristics and methods of analysis is described at the end of the paragraph concerning conclusions drawn.
3.1 Methods of analysis
The different methods of analysis as described in the studies are extracted and presented in the table below. The explanation of these methods of analysis is provided after Table 2 .
Based on these studies it appears that the same term was sometimes used to refer to more than one analysis method, while in other cases, multiple terms were used to refer to a single method. These varieties increase the ambiguity experienced with concept map analysis, as described by Watson et al. ( 2016b ). Based on the ways in which concept map characteristics are estimated, we propose the following distinction: quantitative, similarity, holistic and qualitative analysis. Quantitative analysis, or counting concept map characteristics, was performed absolutely or relatively—for example, the number of links was counted separately or calculated in relation to the number of nodes. Category representation was also determined absolute, as the number of nodes belonging to a category, or relative, dividing the number of nodes belonging to a category by the total number of nodes in a map. These different calculations can result in different conclusions. According to Besterfield-Sacre and colleagues ( 2004 , p. 113), quantitative analysis “fails to capture the quality of that content. Further, these scoring methods can be time consuming, lack standards, and may introduce inappropriate bias.”
Similarity analysis described or calculated the percentage of overlap and/or discrepancy compared to a reference map. To calculate percentage of overlap, the terms used by respondents need to be aligned with the reference map. Similarity analysis provided insights into the (degree of) overlap and discrepancies with a reference map and was performed manually or in an automated manner (Ifenthaler et al. 2011 ).
Holistic analysis included scoring the structure or content for the concept map as a whole. Besterfield-Sacre and colleagues ( 2004 ) developed the scoring rubric that was commonly used for holistic analysis. They developed this rubric to score the overall comprehensiveness, organization and correctness of the map, based on the topics experts discussed while analyzing concept maps. Holistic analysis was determined on an inter-rater basis and is a cognitive complex task for which subject matter knowledge is necessary; this scoring is subjective (Borrego et al. 2009 ; Yaman and Ayas 2015 ).
Qualitative analysis of semantic content was performed in most studies, either inductively or deductively to determine categories. Qualitative analysis was the only way to explore concept maps content inductively.
Most studies applied more than one method of analysis. Quantitative analysis was applied in 19 studies, qualitative analysis also in 19 studies, holistic analysis in six studies and similarity analysis in five studies. Why methods of analysis were chosen is described in several studies. Ritchhart and colleagues ( 2009 , p. 152) stressed that qualitative analysis “allowed us to best represent all of the data from the maps”. Beyerbach ( 1988 , p.339) applied qualitative analysis, as it revealed “the nature of growth of student teachers’ thinking [..] and conceptual development”. Quantitative analysis was chosen as it “demonstrates the student learning gains” (Borrego et al. 2009 , p.14). Similarity analysis was performed as “Comparisons of the students' maps to an expert's map will provide information regarding how much is learned from the course and whether the concepts that are learned and included in the maps are done so "correctly" and as intended according to the expert-the faculty instructor” (Freeman and Urbaczewski 2002 , p. 42). Besterfield-Sacre et al. ( 2004 , p. 109) choose holistic scoring to explore students’ conceptual understanding, as an increase in understanding results “in higher quality maps as reflected by the holistic score.”
3.2 Concept map characteristics
This section describes what concept map characteristics were measured, how and why. Table 3 provides an overview of the results. The concept map characteristics described in this review concern characteristics as portrayed in the included studies. These include characteristics concerning the structure of concept maps, such as size, structural complexity and type of structure, and characteristics concerning the content of concept maps, for instance the terms used or categories represented in concept maps. The different concept map characteristics as portrayed in the included studies are presented below.
The number of nodes was referred to as the size or extent, and considered as “a simple indicator for the size of the underlying cognitive structure” (Ifenthaler et al. 2011 , p. 55). Size was established by counting the number of unique or correct nodes or propositions. Invalid nodes were included to study mental models or when misconceptions were important.
3.2.2 Structural complexity
Structural complexity is concerned with how complex the structure of a concept map is. The concept map nodes and links were used to study structural complexity quantitatively, holistically or in similarity. The scoring system for structural complexity from Novak and Gowin ( 1984 ), based on the number of hierarchies, cross-links and examples, was applied in seven studies, and these measures were adjusted in four of these studies. Specific aspects of structural complexity, were breadth or number of hierarchies and depth or hierarchy level (Beyerbach 1988 ; Read 2008 ). Other references to structural complexity, all calculated based on the number of links, are complexity, connectedness or dynamism and these measures are more commonly used for non-hierarchical concept maps (Ifenthaler et al. 2011 ; Tripto et al. 2018 ; Weiss et al. 2017 ). Freeman and Urbaczewski ( 2002 , p. 45) computed structural complexity as the number of relationships depicted in the map beyond the minimal amount necessary to connect all of the concepts linearly. Ifenthaler and colleagues ( 2011 ) included computations from graph theory, such as unlinked nodes that are not connected to the other nodes, the cyclic nature of a map, i.e. if all nodes can be reached easily, or the longest and/or shortest paths from the central node. Structural complexity was also scored based on a rubric, taking into account the overall organization of the map. For instance a score of 1 if the concept map is connected only linearly, a score of 2 when there are some connections between hierarchies, or a score of 3 for a sophisticated structure (Besterfield-Sacre et al. 2004 ). Another way to score structural complexity is by comparing structural characteristics with a reference map (Ifenthaler et al. 2011 ).
The analysis of structural complexity is more sensitive in measuring change than other analyses (West et al. 2000 ). However, the limited hierarchical interpretation of structural complexity based on quantitative analysis can lead to different scores than holistic scoring of structural complexity (Watson et al. 2016a ). According to West and colleagues ( 2000 , p. 821), scoring structural characteristics “[becomes] more difficult as maps grow more complex,” and Blackwell and Williams ( 2007 , p. 7) mentioned that scoring structural characteristics “can conceal the essentially subjective basis on which it rests.”
3.2.3 Type of structure
Studies concerned with the type of structure or shape of the map categorized concept maps qualitatively based on global morphologies. Global morphologies are common typical structures found in concept maps, such as chain, spoke or net structures, as depicted in Fig. 3 . This analysis provides a measure for the aptitude for learning and “avoids many pitfalls of quantitative analysis” (Hay et al. 2008 , p. 224). Yaman and Ayas ( 2015 , p. 853) categorized concept maps based on their type of structure, and stated that it was “very easy and informative.”
Global morphologies in concept maps (from Kinchin, Hay and Adams 2000 )
3.2.4 Semantic sophistication
Semantic sophistication is concerned with the terms as used by the respondents, for concepts as well as for links. Semantic sophistication was explored by describing or clustering the terms used by the respondents qualitatively. Analysis of the semantic sophistication or content revealed the information in concept maps and what respondents think (Kostromina et al. 2017 ; Ward and Haigh 2017 ): “These qualitative analyses go beyond traditional assessment techniques in providing the instructor with a much clearer view of what his/her students know, think, and understand” (Freeman and Urbaczewski 2002 , p. 51). Semantic sophistication was also scored based on a rubric, taking into account the comprehensiveness or correctness of content, and whether maps conformed to fact, logic or known truth (Besterfield-Sacre et al. 2004 ). Gregoriades and colleagues ( 2009 ) described how holistic scoring allowed them to assess overall understanding. The semantic sophistication was also measured in comparison to a reference map. Beyerbach ( 1988 , p. 341) calculated “convergence towards a group consensus, and convergence toward an expert's map to indicate conceptual growth.” Freeman and Urbaczewski ( 2002 , p. 42) compared students’ maps to an expert’s map to assess how much was learned and whether the learned concepts were integrated correctly.
3.2.5 Category representation
Category representation is concerned with categories of nodes and/or links in concept maps. Different types of categories were established, either valid and invalid nodes or propositions, where invalid nodes are outside of the scope of the prompt, and invalid propositions are incorrectly linked. Another category was old and new nodes in repeated measures, where old nodes were already present in the first map, and new nodes were added in the second map. Also content-related categories were distinguished, for instance concepts at different levels. One study distinguished different system levels, in order to reveal students’ systems thinking abilities—or, more specifically, students’ “ability to identify system components and processes at both micro and macro levels” (Tripto et al. 2018 , p. 649). Category representation can only be calculated quantitatively after categories are determined in maps qualitatively. Category representation was calculated by the number of nodes per category and was also referred to as knowledge richness, frequencies of themes, presence of systems, representational level or category distribution (Çakmak 2010 ; Kostromina et al. 2017 ; Ritchhart et al. 2009 ; Tripto et al. 2018 ; Yaman and Ayas 2015 ). Ritchhart and colleagues ( 2009 , p. 154) calculated the percent of responses in each category. Çakmak ( 2010 ) studied perceptions about roles based on the number of concepts assigned to each role.
3.2.6 Interlinkage
Interlinkage concerns the links between categories, and can only be calculated after categories are established. Interlinkage was also referred to as ‘complexity’ or ‘degree of interconnectedness.’ Interlinkage was interpreted as “students’ ability to identify relations between system components” (Tripto et al. 2018 , p. 649). Specifically, the interlinkage between old and new nodes was used to study learning, or how new knowledge is connected to existing knowledge (Hay et al. 2008 ). Güccük and Köksal ( 2016 ) explored meaningful learning based on the number of interlinks and interpreted more interlinks as more meaningful learning. Ward and Haigh ( 2017 , p. 1248) concluded that the analysis of interlinkage between old and new nodes allowed for holistic examination of the quality of learning.
3.2.7 Complexity index
The complexity index is calculated based on the number of concepts, number of categories, and number of links between categories. It was calculated in two studies to “characterize the overall coverage of and connectedness between the categories” (Watson et al. 2016b , p. 549). The complexity index is a particularization of interlinkage, calculated by dividing the number of interlinks by the number of categories, then multiplying this number with the number of nodes (Segalàs et al. 2012 , p. 296).
A variety of concept map characteristics was considered, leading to different insights. Size was measured in 18 studies. Structural complexity was also taken into account in 18 studies. Structural complexity considered nodes and links and seems relatively easy and objective to determine; however, it is more interpretative than it seems, especially as concept maps grow more complex. Type of structure was measured in three studies, and revealed the overall structure of the concept map, disregarding the content and allocating one score for the overall structure of the map. Although it is a time-consuming step to describe and interpret terms used by respondents, this is the only way to gain insights into the semantic content of the maps. The semantic sophistication was taken into account in 13 studies. Terms used were sorted into themes or categories, which was done in eleven studies, either inductively or deductively, based on a theoretical framework or scoring rubric, or in comparison with a reference map. Evaluating the terms used and categorizing or unifying them was a necessary preliminary step for calculating other concept map characteristics, namely: category representation, interlinkage and complexity index. These characteristics were only considered when meaningful categories were present and interconnection of these categories was convenient, for instance, in the case of systems thinking. Interlinkage was determined in five studies and the complexity index in two studies.
Explanation of the rationale for concept map characteristics and measures varied from just mentioning which characteristics are measured and how, to studies that explain their operationalization based on theoretical descriptions of the research object that is explicitly deduced into specific concept map characteristics and measures. Some studies explicitly explained the choice for concept map characteristics based on the conclusions to be drawn. For instance Besterfield-Sacre et al. ( 2004 , p.106) explain counting cross-links as follows: “We propose that measuring inter-relatedness is a way to assess the extent of knowledge integration.” How concept map characteristics were related to methods of analysis, is described in Table 3 .
3.3 Conclusions drawn in the studies
The different conclusions drawn in the included studies about knowledge or learning are presented below. Conclusions about knowledge, for instance knowledge extent, were based on the number of nodes (Gregoriades et al. 2009 ). In repeated measures, an increase in number of nodes was interpreted as “more detail” (Beyerbach 1988 , p. 345) or “greater domain knowledge” (Freeman and Urbaczewski 2002 , p. 45). Counting the nodes was performed to “quantify knowledge understanding” (Besterfield-Sacre et al. 2004 , p. 105). Conclusions about an “increase in richness” (Van den Boogaart et al. 2018 , p. 297) or “balanced understanding” (Watson et al. 2016b , p. 556) were based on counting the number of nodes per category. Conclusions about better coverage and interconnectedness or systemic thinking were based on the complexity index (Segalàs et al. 2012 ). Conclusions about what respondents knew, or in repeated measures about how their knowledge changed over time were based on describing the content of concept maps (Freeman and Urbaczewski 2002 , p. 42). It “revealed that teachers assign a significant role both to its own activity and activity of the University administration, as well as cooperation with students” (Kostromina et al. 2017 , p. 320).
Conclusions about the complexity of knowledge, or the complexity of the knowledge structure, were based on the number of links. For instance, a conclusion about “more complex constructions of their knowledge” was based on the number of links, or structural complexity of concept maps (Read 2008 , p. 127). In repeated measures, conclusions about “conceptual growth” were drawn based on structural complexity measures (Beyerbach 1988 , p. 342). Conclusions about knowledge integration and learning gains (Borrego et al. 2009 ) were based on scoring the structural quality of concept maps based on a rubric and, in repeated measures, about additional conceptual understanding (Besterfield-Sacre et al. 2004 ; Watson et al. 2016b ). Conclusions about the use of semantically correct concepts (Ifenthaler et al. 2011 ), or correct integration of concepts (Freeman and Urbaczewski 2002 ), were based on a comparison with a reference map. Other conclusions drawn based on comparison with a reference map were that students have significant misconceptions (Gregoriades et al. 2009 ), or that respondents gained a better understanding (Freeman and Urbaczewski 2002 ; Ifenthaler et al. 2011 ). Conclusions about meaningful learning were based on counting the number of links between old and new concepts (Hay 2007 ). Conclusions about development were also based on the type of structure of concept maps in repeated measures. Conclusions drawn based on the type of structure were in one study, that pre- and post-maps were both mainly non-hierarchical (Yaman and Ayas 2015 ), and in one study, that 16 of 18 respondents’ pre- and post-maps showed “remarkable structural homology, even where the content and its internal organisation were different” (Hay et al. 2008 , p. 233).
Most studies applied more than one method of analysis and combined concept map characteristics when conclusions were drawn. Two of the three studies applying one method of analysis, qualitatively described the terms used in maps. The other study that applied one method of analysis, explored the semantic sophistication and structural complexity holistically. All other studies analyzed at least one concept map characteristic with two methods of analysis (for instance combining quantitative and similarity analysis of structural complexity), but most commonly multiple concept map characteristics and multiple methods of analysis were applied. However, a conclusion concerning counting different concept map characteristics was that it has shown opposing results within several studies: “While cross link scores were lower in some cases, hierarchy scores increased dramatically demonstrating that students were seeing each proposition in greater depth” (Blackwell and Williams 2007 , p. 6). Or in the study of Freeman and Urbaczewski ( 2002 ), where structural complexity scores decreased while all other scores increased. In all studies, an increase in a measure or concept map characteristic was interpreted as conceptual development or growth, and in all but one repeated measures studies, development was found. This particular study described the main themes based on qualitative analysis of the terms used, without interpreting this as development. Two studies mentioned that the number of links or cross-links did not increase, and two studies found homogenous types of structures, but still concluded that understanding increased, mainly based on other measures.
Although most studies draw conclusions about conceptual understanding or in repeated measures about conceptual growth, conclusions drawn are related to the methods of analysis applied and concept map characteristics considered. Conclusions about an increase or growth, are mainly based on counting structural concept map characteristics, or applying quantitative analysis. Conclusions about meaningful learning and more balanced understanding, were also based on quantitative analysis. Conclusions about knowledge, learning or conceptual growth, or integration of knowledge were based on a comparison with a reference map. Conclusions concerning knowledge integration, learning and coverage were based on holistic analysis. Conclusions about the content of maps, and what respondent know or what themes they mention, were based on qualitative analysis of terms used.
4 Conclusion
The central research question was: Which methods of analysis are applied to open-ended concept maps when studying knowledge and learning, and how are these associated with concept map characteristics considered and conclusions drawn? The conclusions are presented based on the three main aspects of the research question, namely methods of analysis, concept map characteristics and conclusions drawn, as well as their mutual associations.
4.1 Methods of analysis
This review explored the methods of analysis applied in open-ended concept map studies and provided a first step towards exploring which methods of analysis are applied and how. Four categories of methods of analysis were identified, namely: (1) quantitative analysis based on counting concept map characteristics; (2) similarity analysis based on a comparison with a referent map; (3) holistic analysis that entails the scoring of maps as a whole based on a rubric; and (4) qualitative analysis that involves describing characteristics, for instance the terms used.
The 25 studies applied different methods of analysis. Due to the idiosyncratic nature of the data stemming from open-ended concept maps they can be analyzed in different ways (Novak 1990 ). Qualitative and quantitative analysis are most commonly applied to open concept maps, but to make concept maps more comparable, it is common to use both methods, in which case quantitative analysis is preceded by qualitative analysis. Quantitative analysis is performed to count differences between maps. Similarity analysis explores the overlap with a reference map based on the nodes or structural characteristics. Holistic analysis scores the structure and content of concept maps. Qualitative analysis is used to explore or describe concept map characteristics and to explore the uniqueness of each map.
Each method of analysis deals with the idiosyncratic data differently. Qualitative analysis of semantic sophistication is the only way to explore the idiosyncratic nature of open-ended concept maps and the terms for concepts as the respondents use them. Quantitative analysis reduces the unique terms respondents use to numbers. Similarity and holistic analyses value the terms used based on an existing framework and provide a score for overlap or correctness respectively. When an open-ended concept map is used to gather the unique terms respondents use and there is no correct map available, qualitative analysis is required to explore or describe this information or to make quantitative analysis more meaningful.
4.2 Concept map characteristics
Concept map characteristics are not always explicitly described, and many different descriptions are used for similar concept map characteristics. This study distinguished between seven concept map characteristics as described in the included articles. Concept map characteristics that were counted or evaluated quantitatively are size, structural complexity, category representation, interlinkage and complexity index. These are all related to structure, except for category representation, as this referred to the number of concepts per category. The type of structure, semantic sophistication, categories and interlinkage can be described or evaluated qualitatively. These are all related to the content of the map, except for type of structure. The structural complexity and semantic sophistication can also be evaluated in relation to a reference map based on a rubric. Similarity and holistic methods of analysis combine structural and content-related features of concept maps.
4.3 Conclusions drawn in the studies
Our review shows that although the methods of analysis vary, the conclusions drawn are quite similar. Despite whether concept map characteristics were counted, compared, scored or described, conclusions were drawn about understanding or conceptual growth in repeated measures. All studies with repeated measures applying quantitative analysis found an increase of a measure that was interpreted as conceptual growth. Similarity analysis in repeated measures revealed an increased overlap in specific measures, which was considered as development of understanding. Holistic analysis revealed that better understanding or knowledge integration was found in repeated measures. Three studies used qualitative analysis to identify conceptual growth, for instance, the concept of leadership, where students considered leadership more as a process in the post-test. Twenty of the 21 studies with repeated measures found some type of development or learning gains, most commonly referred to as conceptual growth.
4.4 Associations across articles
Associations were explored between the coding of the methods of analysis, the concept map characteristics, and the conclusions drawn, in order to provide guidelines for methodological coherence between these aspects. Figure 4 provides an overview of the types of conclusions that can be drawn from open-ended concept maps, in accordance with the identified methods of analysis and concept map characteristics.
Associations between methods of analysis, concept map characteristics and types of conclusions
Figure 4 can serve as a guide for future open-ended concept map studies which use the specific types of conclusions to be drawn as a means of deciding what method of analysis to apply and what concept map characteristics to consider. For instance, in cases of quantitative analysis, Fig. 4 suggests that no conclusions can be drawn about correctness or quality, only about the extent of domain knowledge, and an increase or decrease in repeated measures. In similarity analysis, correct and incorrect nodes and links are determined, based on a correct model. Therefore, conclusions can be drawn concerning correctness. When applying a rubric for holistic scoring, one overall score is often given for the entire map, in which the overall quality is scored (Besterfield-Sacre et al. 2004 ). Quality of content includes correctness, but only for the map as a whole. The concept map characteristics of size, category representation and semantic sophistication consider the nodes and lead to conclusions about knowledge. The concept map characteristics of structural complexity, interlinkage, complexity index and type of structure consider both the nodes and the links and lead to conclusions about knowledge structure or integration. By explicitly using the conclusion to be elicited as a basis for choosing methods of analysis and concept map characteristics, the transparency of research increases, which enables better quality assessment (Coombs 2017 ; Verhage and Boels 2017 ).
5 Discussion
When relating these conclusions to broader theory, the first point of discussion is that 20 out of 21 repeated measures studies identified learning or conceptual growth. This raises the question whether all development is interpreted as development, and whether an increase in nodes and links represents better understanding or not. Rikers, Schmidt and Boshuizen ( 2000 ), who studied encapsulated knowledge and expertise in diagnosing clinical cases, found that the proportion of encapsulating concepts increases as an indicator of expertise development. This entails a decrease in the number of nodes and links as expertise develops, as experts are able to differentiate between concepts and relationships that are more and less relevant according to a specific contexts. Accordingly, Mintzes and Quinn ( 2007 ) explore different phases in expertise development based on meaningful learning theory. Their distinction between phases of development is based on the number of expert concepts, which in turn are relevant superordinate concepts that are absent from novices’ concept maps. Accordingly, Schwendimann ( 2019 ), who studied the process of development of concept maps, also found differences between novices and experts mainly in the professional terminology experts use for their concepts and linking words. Therefore, the conclusion that an increase is always better is contradicted by many studies of expertise development in the field of cognitive science (Chi, Glaser and Farr 1988 ).
Our review did not aim to discuss the value of open-ended concept maps as an instrument to study knowledge or knowledge development. Nor did it aim to explore the validity of different methods of analysis, or determine which method of analysis is most valid, as these methods of analysis can be related to different research purposes or research objects (Kim and Clariana 2015 ). Quantitative analysis is based on an evaluative approach which assesses knowledge or growth based on specific measures or characteristics, such as size or complexity. Similarity and holistic methods analyze concept maps from expected structures or content and have an evaluative or prescriptive purpose. Similarity analysis and holistic analysis take a more normative approach to the analysis of open-ended concept maps, by comparing them to a reference map or scoring the map based on a rubric, respectively. On the other hand, qualitative analysis has a more explorative purpose. Merriam and Grenier ( 2019 ) explain similar purposes of qualitative research methods and point out that more open or qualitative analysis is suited to more explorative purposes, while more restricted approaches are more appropriate for evaluative purposes.
This review has several limitations. Only studies applying open-ended concept maps to study knowledge and learning were included. The results of this study could be different when reviewing studies that apply more closed concept maps, or studies that combine the application of concept maps with other research instruments. Also, the research objects are not included in Fig. 4 , as references to research objects were ambiguous in previous studies and it was unclear whether studies referred to the same objects differently, or studied different objects. As a result, this review focused on the process of analysis, disregarding what aspects of knowledge or learning were studied. Moreover, Fig. 4 provides no guidelines for alignment with other aspects of coherence in qualitative studies, for instance the philosophical positioning, the fundamental beliefs or theoretical perspective taken (Caelli et al. 2003 ; Davis 2012 ).
The findings in this review could be substantiated by further research exploring implicit choices or implicit methodological coherence that could not be extracted from the articles. This could take the form of interviews with the authors of the studies about their methodological assumptions, approaches and chosen methods of analysis. They could then be asked why and how they made choices related to their research object, the concept map characteristics they considered and the conclusions they drew.
While previous reviews by Ruiz-Primo and Shavelson ( 1996 ), Anohina and Grundspenkis ( 2009 ) and Strautmane ( 2012 ) explored aspects of the process of analysis separately, or related the method of analysis applied to the level of openness of the concept map task, this review examined three aspects of the analysis process in coherence. By doing so, the present study aims to inform the ongoing discussion in social sciences and beyond about the quality of analysis. Unfortunately, open-ended concept map studies often still feature ambiguous language use. This ambiguity decreases transparency about the method of analysis, the concept map characteristics, and, ultimately, the conclusions drawn and the methodological coherence of these aspects (Chenail et al. 2011 ; Seale 1999 ). Clarifying which approach is chosen to make sense of the information in open-ended concept maps provides a method of dealing with idiosyncratic information provided by the respondents and will support other researchers or policy makers to better interpret and value the conclusions drawn. By describing studies on the basis of the proposed distinction between methods of analysis applied and how they interpret or value information from concept maps, the constraints of each method can be discussed, and findings or conclusions can be understood with a degree of confidence (Chenail et al. 2011 ). This distinction between methods of analysis can enhance transparency about the conclusions to which a specific method of analysis can and cannot lead. Clarity about the choices within and across studies is stimulated by uniform referencing to these choices, which decreases the confusion caused by the variety of ways in which scholars refer to similar constructs. In future research, the guidelines provided in this study will assist scholars to make more informed choices for their analysis of idiosyncratic data gathered with open-ended concept maps.
Data availability
The data that support the findings of this study are the papers as mentioned in the results and summarized in Appendix A. They are also indicated with an * in the references section of this review. The materials used to code this data are provided in the article. The condensed data that support the findings of this study are available on request from the corresponding author Kirsten de Ries. The data are not publicly available due to the fact that not all these paper are Open Access.
Code availability
No computer codes or mathematical algorithm is used in this paper. The coding of our data was performed by the authors based on the coding scheme presented in the data section.
References indicated with * were included in the literature review
*Anohina, A., Grundspenkis, J.: Scoring concept maps: an overview. Comp. Sys. Tech. (2009). https://doi.org/10.1145/1731740.1731824
Article Google Scholar
Ayres, L., Kavanaugh, K., Knafl, K.A.: Within-case and across-case approaches to qualitative data analysis. Qual. Health Res. 13 , 871–883 (2003)
*Besterfield-Sacre, M., Gerchak, J., Lyons, M.R., Shuman, L.J., Wolfe, H.: Scoring concept maps: an integrated rubric for assessing engineering education. J. Eng. Educ. 93 , 105–115 (2004)
*Beyerbach, B.A.: Developing a technical vocabulary on teacher planning: preservice teachers’ concept maps. Teach. Teach. Educ. 4 , 339–347 (1988)
*Blackwell, C., Williams, J.: The utilization of concept maps in evaluating leadership comprehension. Proc. 2007 AAAE Res. Conf. 34, 698–707 (2007)
*Borrego, M., Newsmander, C., McNair, L.D., McGinnis, S.P.: Using concept maps to assess interdisciplinary integration of green engineering knowledge. Adv. Eng. Educ. 1 , 1–25 (2009)
Google Scholar
Bressington, D.T., Wells, H., Graham, M.: A concept mapping exploration of social workers’ and mental health nurses’ understanding of the role of the approved mental health professional. Nurse Educ. Today (2011). https://doi.org/10.1016/j.nedt.2010.10.034
Buhmann, S.Y., Kingsbury, M.: A standardized holistic framework for concept map analysis combining topological attributes and global morphologies. Knowl. Man. E-Learn. 7 , 20–35 (2015)
Caelli, K., Ray, L., Mill, J.: ‘Clear as Mud’: toward greater clarity in generic qualitative research. Int. J. Qual. Meth. 2 (2), 1–16 (2003)
*Çakmak, M.: An examination of concept maps created by prospective teachers on teacher roles. Procd. Soc. Behv. (2010). https://doi.org/10.1016/j.sbspro.2010.03.354
Cetin, B., Güler, N., Sarica, R.: Using generalizability theory to examine different concept map scoring methods. EJER (2016). https://doi.org/10.14689/ejer.2016.66.12
Chenail, R.J., Duffy, M., St George, S., Wulff, D.: Facilitating coherence across qualitative research. TQR 16 , 263–275 (2011)
Chi, M., Glaser, R., Farr, M.: The nature of expertise. Erlbaum, Hillsdale, New Jersey (1988)
Coombs, C.: Coherence and transparency: some advice for qualitative researchers. Production (2017). https://doi.org/10.1590/0103-6513.006817
Creswell, J.W.: Educational research: planning, conducting and evaluating quantitative and qualitative research. Preston, Boston (2012)
Davis, J.A.: Methodological coherence: establishing a unified research frame/La cohérence méthodologique: établir un cadre de recherche unifié. Can. J. Occup. Ther. (2012). https://doi.org/10.2182/cjot.2012.79.3.1
Dori, D.: ViSWeb - the visual semantic web: unifying human and machine knowledge representations with object-process methodology. VLDB J. (2004). https://doi.org/10.1007/s00778-004-0120-x
*Freeman, L.A., Urbaczewski, A.: Concept maps as an alternative technique for assessing students' understanding of telecommunications. Proc. of ICIER (2002)
Gough, D., Oliver, S., Thomas, J.: Introduction to systematic reviews. Sage, London (2012)
Greene, B.A., Lubin, I.A., Slater, J.L., Warden, S.E.: Mapping changes in science teachers’ content knowledge: concept maps and authentic professional development. J. Sci. Educ. Technol. (2013). https://doi.org/10.1007/s10956-012-9393-9
*Gregoriades, A., Pampaka, M., Michail, H.: Assessing students’ learning in misusing concept mapping. J. Inf. Sys. Educ. 20 (4), 419–430 (2009)
*Güccük, A., Köksal, M.S.: The effect of case teaching on meaningful and retentive learning when studying genetic engineering. J. Biol. Educ. (2016). https://doi.org/10.1080/00219266.2016.1182049
*Hay, D.B.: Using concept maps to measure deep, surface and non-learning outcomes. Stud. High. Educ. (2007). https://doi.org/10.1080/03075070601099432
*Hay, D.B., Wells, H., Kinchin, I.M.: Quantitative and qualitative measures of student learning at university level. High. Educ. (2008). https://doi.org/10.1007/s10734-007-9099-8
*Ifenthaler, D., Masduki, I., Seel, N.M.: The mystery of cognitive structure and how we can detect it: tracking the development of cognitive structures over time. Instr. Sci. 39 , 41–61 (2011)
Jirásek, I., Plevová, I., Jirásková, M., Dvorácková, A.: Experiential and outdoor education: the participant experience shared through mind maps. Stud. Contin. Educ. 38 (3), 334–354 (2016)
Kim, K., Clariana, R.: Knowledge structure measures of reader’s situation models across languages: translation engenders richer structure. Tech. Know. Learn. (2015). https://doi.org/10.1007/s10758-015-9246-8
Kinchin, I.M.: Visualising powerful knowledge to develop the expert student a knowledge structures perspective on teaching and learning at university. Sense Publishers, Rotterdam (2016)
Kinchin, I.M., Hay, D.B., Adams, A.: How a qualitative approach to concept map analysis can be used to aid learning by illustrating patterns of conceptual development. Educ. Res. (2000). https://doi.org/10.1080/001318800363908
*Kostromina, S., Gnedykh, D., Ruschack, E.A.: Russian university teachers’ ideas about pedagogic frailty. Knowl. Man. E-Learn. Int. J. 9 (3), 311–328 (2017)
Marriott, R.C.V., Torres, P. L.: Formative and summative assessment of concept maps. In: Cañas, A., Reiska, P., Novak, J. (eds.) Innovating with concept mapping, 7th Int. CMC (2016) doi: https://doi.org/10.1007/978-3-319-45501-3
Merriam, S.B., Grenier, R.S.: Qualitative research in practice: examples for discussion and analysis. Jossey-Bass, San Francisco (2019)
Miles, M.B., Huberman, M.A.: Qualitative data analysis: an expanded sourcebook. Sage, Thousand Oaks (1994)
Mintzes, J., Quinn, H.J.: Knowledge restructuring in biology: testing a punctuated model of conceptual change. Int. J. Sci. Math. Educ. 5 , 281–306 (2007)
Nair, S.M., Narayanasamy, M.: The effects of utilising the concept maps in teaching history. Int. J. Instr. (2017). https://doi.org/10.12973/iji.2017.1038a
Novak, J.D.: Concept mapping: a useful tool for science education. J. Res. Sci. Teach. (1990). https://doi.org/10.1002/tea.3660271003
Novak, J.D., Cañas, A.J.: The theory underlying concept maps and how to construct them. Technical Report IHMC CmapTools. Rev 01–2008, FIHMC (2008), available at: http://cmap.ihmc.us/Publications/ ResearchPapers/TheoryUnderlyingConceptMaps.pdf
Novak, J.D., Gowin, D.B.: Learning how to learn. Cambridge University Press, Cambridge (1984)
*Pearsall, N.R., Skipper, J., Mintzes, J.: Knowledge restructuring in the life sciences: a longitudinal study of conceptual change in biology. Sci. Educ. 81 (2), 193–215 (1997)
Poucher, Z.A., Tamminen, K.A., Caron, J.G., Sweet, S.N.: Thinking through and designing qualitative research studies: a focused mapping review of 30 years of qualitative research in sport psychology. Int. Rev. Sport Exerc. Psychol. (2020). https://doi.org/10.1080/1750984X.2019.1656276
*Read, S.: Concept mapping: evaluating the language arts methods course. J. Scholarsh. Teach. Learn. 8 (3), 119–129 (2008)
Rikers, R., Schmidt, H., Boshuizen, H.: Knowledge encapsulation and the intermediate effect. Contemp. Educ. Psychol. (2000). https://doi.org/10.1006/ceps.1998.1000
*Ritchhart, R., Turner, T., Hadar, L.: Uncovering students’ thinking about thinking using concept maps. Metacognition Learn. (2009). https://doi.org/10.1007/s11409-009-9040-x
Ruíz-Primo, M.: On the use of concept maps as an assessment tool in science: What we have learned so far. Revista Electrónica de Investigación Educativa, 2(1), (2000). Retrieved from: http://redie.uabc.mx/vol2no1/contents-ruizpri.html
*Ruiz-Primo, M.A., Shavelson, R.J.: Problems and issues in the use of concept maps in science assessment. J. Res. Sci. Teach. 33 (6), 569–600 (1996)
Ruiz-Primo, M.A., Schultz, S.E., Li, M., Shavelson, R.J.: Comparison of the reliability and validity of scores from two concept-mapping techniques. J. Res. Sci. Teach. 38 (2), 260–278 (2001)
Schwendimann, A.B.: Comparing expert and novice concept map construction. In: Cañas, A.J., Reiska, P., Novak, J.D. (eds.) Innovating with concept mapping: 7th international conference on concept mapping, pp. 16–28. Springer International Publishing AG, Basel Switzerland (2019)
Seale, C.: Quality in qualitative research. Qual. Inq. (1999). https://doi.org/10.1177/107780049900500402
*Segalàs, J., Mulder, K.F., Ferrer-Balas, D.: What do EESD “experts” think sustainability is? which pedagogy is suitable to learn it? Results from interviews and cmaps analysis gathered at EESD 2008. Int. J. Sustain. High. Educ. (2012). https://doi.org/10.1108/14676371211242599
Stevenson, A., Hartmeyer, B., Bentsen, P.: systematically reviewing the potential of concept mapping technologies to promote self-regulated learning in primary and secondary science education. Educ. Res. Rev. 21 , 1–16 (2017)
*Strautmane, M.: Concept map-based knowledge assessment tasks and their scoring criteria: an overview. In: Cañas, A.J., Novak, J.D., Vanhear, J. (eds.), Concept maps: Theory, methodology, technology. Proc. Fifth Int. Conf. Concept Mapping (vol. 2) pp. 80–88. University of Malta, Valletta, Malta (2012)
Tan, S., Erdimez, O., Zimmerman, R.: Concept mapping as a tool to develop and measure students understanding in science. Acta Didact. Napoc. (2017). https://doi.org/10.24193/adn.10.2.9
*Tripto, J., Ben-Zvi Assaraf, O., Amit, M.: Recurring patterns in the development of high school biology students’ system thinking over time. Instr. Sci. (2018). https://doi.org/10.1007/s11251-018-9447-3
*Van den Boogaart, A.C.M., Hummel, H.G.K., Kirschner, P.A.: Explicating development of personal professionals theories from higher vocational education to beginning a professional career through computer-supported drawing of concept maps. Prof. Dev. Educ. (2018). https://doi.org/10.1080/19415257.2017.1288652
Verhage, A., Boels, D.: Critical appraisal of mixed methods research studies in a systematic scoping review in plural policing: assessing the impact of excluding inadequately reported studies by means of a sensitivity analysis. Qual. Quan. (2017). https://doi.org/10.1007/s11135-016-0345-y
*Ward, G., Haigh, M.: Challenges and changes: developing teachers’ and initial teacher education students’ understandings of the nature of science. Res. Sci. Educ. 47 (6), 1233–1254 (2017)
*Watson, M.K., Pelkey, J., Noyes, C.R., Rodgers, M.O.: Assessing conceptual knowledge using three concept map scoring methods. J. Eng. Educ. 105 (1), 118–146 (2016a)
Watson, M.K., Pelkey, J., Noyes, C.R., Rodgers, M.O.: Assessing impact of a learning-cycle-based module on students’ conceptual sustainability knowledge using concept maps and surveys. J. Clean. Prod. (2016b). https://doi.org/10.1016/j.clepro.2016.04.063
*Weiss, M.P., Pellegrino, A., Brigham, F.J.: Practicing collaboration in teacher preparation: effects of learning by doing together. Teach. Educ. Spec. Educ. 40 (1), 65–67 (2017)
*West, D.C., Pomeroy, J.R., Park, J.K., Gerstenberger, E.A., Sandoval, J.: Critical thinking in graduate medical education: a role for concept mapping assessment? Am. Med. Ass. 284 (9), 1105–1110 (2000)
*West, D.C., Pomeroy, J.R., Park, J.K., Gerstenberger, E.A., Sandoval, J.: Critical thinking in graduate medical education: a role for concept mapping assessment? Med. Educ. 36 (9), 820–826 (2002)
Wheeldon, J., Fauber, J.: Framing experience: concept maps, mind maps, and data collection in qualitative research. Int. J. Qual. Meth. 8 (3), 68–83 (2009)
*Wormnaes, S., Mkumbo, K., Skaar, B., Refseth, Y.: Using concept maps to elicit and study student teachers’ perceptions about inclusive education: a Tanzanian experience. J. Educ. Teach. (2015). https://doi.org/10.1080/02607476.2015.1081724
*Yaman, F., Ayas, A.: Assessing changes in high school students’ conceptual understanding through concept maps before and after the computer-based predict-observe-explain (CB-POE) task on acid-base chemistry at the secondary level. Chem. Educ. Res. Pract (2015). https://doi.org/10.1039/c5rp00088b
Yin, Y., Vanides, J., Ruiz-Primo, M.A., Ayala, C.C., Shavelson, R.J.: Comparison of two concept-mapping techniques: implications for scoring, interpretation, and use. J. Res. Sci. Teach. 42 (2), 166–184 (2005)
Download references
Open Access funding provided by the Dutch Organization for Scientific Research, RAAK-Pro.
Author information
Authors and affiliations.
iXperium/Centre of Expertise Teaching and Learning With Ict, HAN University of Applied Sciences, P O Box 30011, 6503 HN, Nijmegen, Netherlands
Kirsten E. de Ries, Anne-Marieke M. J. A. P. van Loon & Marijke M. H. Kral
You can also search for this author in PubMed Google Scholar
Corresponding author
Correspondence to Kirsten E. de Ries .
Ethics declarations
Conflicts of interests.
The author has no affiliations with or involvement in any organization or entity with any financial interest or non-financial interest in the subject matter or materials discussed in this manuscript.
Consent for publication
Consent for publication was necessary to carry out the study as there is no primary data used in the paper.
Consent to participate
Consent to participate was necessary to carry out the study as there is no primary data used in the paper.
Ethics approval
No ethical approval was necessary to carry out the study as there is no primary data used in the paper.
Additional information
Publisher's note.
Springer Nature remains neutral with regard to jurisdictional claims in published maps and institutional affiliations.
Rights and permissions
Open Access This article is licensed under a Creative Commons Attribution 4.0 International License, which permits use, sharing, adaptation, distribution and reproduction in any medium or format, as long as you give appropriate credit to the original author(s) and the source, provide a link to the Creative Commons licence, and indicate if changes were made. The images or other third party material in this article are included in the article's Creative Commons licence, unless indicated otherwise in a credit line to the material. If material is not included in the article's Creative Commons licence and your intended use is not permitted by statutory regulation or exceeds the permitted use, you will need to obtain permission directly from the copyright holder. To view a copy of this licence, visit http://creativecommons.org/licenses/by/4.0/ .
Reprints and permissions
About this article
de Ries, K.E., Schaap, H., van Loon, AM.M.J.A.P. et al. A literature review of open-ended concept maps as a research instrument to study knowledge and learning. Qual Quant 56 , 73–107 (2022). https://doi.org/10.1007/s11135-021-01113-x
Download citation
Accepted : 11 February 2021
Published : 24 February 2021
Issue Date : February 2022
DOI : https://doi.org/10.1007/s11135-021-01113-x
Share this article
Anyone you share the following link with will be able to read this content:
Sorry, a shareable link is not currently available for this article.
Provided by the Springer Nature SharedIt content-sharing initiative
Literature review
Concept maps
Find a journal
Publish with us
Track your research
Directories
Concept mapping
Lit review-type sources
Grey literature
Public affairs news
Discipline-specific tools
Writing & research help
Start Your Research
Research Guides
University of Washington Libraries
Library Guides
UW Libraries
Literature review toolkit for policy studies
Literature review toolkit for policy studies: Concept mapping
Why create a concept map.
A concept map is a visualization of key idea in your research and the relationships between them. To create a concept map, pick out the main concepts of your topic and brainstorm everything you know about them, drawing shapes around your concepts and clustering the shapes in a way that's meaningful to you. How can this help?
Helps you pull back to see the broader concepts at play.
Can help identify the subject-based tool where literature can be found.
Helps clarify both what you already know and where you have gaps in your knowledge.
Literature Review: The What, Why and How-to Guide — How to Pick a Topic
Getting Started
Introduction
Strategies to Find Sources
Evaluating Sources & Lit. Reviews
Tips for Writing Literature Reviews
Writing Literature Review: Useful Sites
Citation Resources
Other Academic Writings
Picking a Topic and Keywords to Research your Topic
Whether you are writing a literature review as a standalone work or as part of a paper, choosing a topic is an important part of the process. If you haven't select a topic yet for your literature view or you feel that your topic is too broad, this page is for you!
The key to successfully choosing a topic is to find one that is not too broad (impossible to adequately cover) but also not too narrow (not enough has been written about it). Use the tools below to help you brainstorm a topic and keywords that then you can use to search our many databases. Feel free to explore these different options or contact a Subject Specialist if you need more help!
Concept Mapping
[REMOVE] Mind Mapping (also known as Concept Mapping) A helpful handout to show step by step how to create a concept map to map out a topic.
Picking a topic and search terms
Below are some useful links and handouts that help you develop your topic. Check the handouts in this page. They are useful to help you develop keywords/search terms or to learn the best way to search databases to find articles and books for your research.
UVA Thinking Tool: Choosing a Topic and Search Terms Provides a template for focusing a research assignment through the brainstorming of ideas, keywords, and other terminology related to a topic.
UW How to Improve Database Search Results Suggested strategies for retrieving relevant search results
UCLA: Narrowing a Topic Useful tips on how to narrow a topic when you are getting too many results in your search. From the librarians at UCLA.
UCLA: Broadering a Topic Useful tips on how to broaden your topic when you are getting few results in your search. From the librarians at UCLA.
Creating a Comprehensive Literature Review Map: A Step-by-Step Example
backlinkworks
Writing Articles & Reviews
October 16, 2023
A literature review is an essential component of any academic research paper or thesis. IT involves examining existing literature, scholarly articles, books, and other sources related to your research topic. A literature review map acts as a visual representation of the concepts, studies, and theories that have been covered in the literature. In this article, we will guide you through the process of creating a comprehensive literature review map, step-by-step, to help you structure and organize your literature review effectively.
Step 1: Define Your Research Topic
The first step in creating a literature review map is to clearly define your research topic. Be specific and narrow down your focus to ensure that you have a manageable scope for your literature review. Take into consideration the research objectives or guiding questions that will shape your review.
Step 2: Identify Relevant Keywords
Once you have defined your research topic, identify the keywords and search terms that are most relevant to your study. Brainstorm a list of potential keywords that are commonly used in the literature related to your topic. These keywords will help you locate relevant sources during your literature search.
Step 3: Conduct a Thorough Literature Search
Using databases and search engines specific to your field of study, begin conducting a thorough literature search using the identified keywords. Take note of the key articles, books, and studies that are relevant to your research topic. In this step, IT is important to evaluate the credibility and quality of the sources to ensure that you are referring to reputable and reliable information.
Step 4: Read and Analyze the Literature
After collecting a substantial number of sources, carefully read and analyze each one. Highlight key concepts, methodologies, and findings that are relevant to your research. As you progress, make notes or annotations to help you remember important details and connections between different sources.
Step 5: Organize the Literature
Now that you have read and analyzed the literature, IT ‘s time to organize the information into a coherent structure. One effective way to do this is by using a literature review map. Start by creating categories or themes based on the concepts or theories that emerge from the literature. Group together similar ideas or findings to create a visual representation of the interconnectedness of the sources.
Step 6: Create the Literature Review Map
With your categorized information, you can now create the literature review map. This can be done using software such as Microsoft Word, PowerPoint, or dedicated mind mapping tools. Start with your main research topic in the center and branch out with subcategories based on the themes or concepts identified earlier. Connect relevant sources to each subcategory, illustrating how they contribute to the overall understanding of your research topic.
Step 7: Revise and Refine
Review your literature review map for coherence and completeness. Ensure that all the key sources are accurately placed within the appropriate category or subcategory. Check for any gaps in your coverage and make sure that the map represents a comprehensive overview of the literature on your research topic.
Q: How many sources should I include in my literature review map?
A: The number of sources you include will depend on the requirements of your research and the depth of analysis you aim to achieve. However, IT is generally recommended to thoroughly examine a range of sources, including both seminal texts and recent publications, to ensure a well-rounded and comprehensive literature review.
Q: How do I determine the credibility of the sources for my literature review?
A: Evaluating the credibility of your sources is crucial to ensure that you are basing your review on reputable information. Consider the author’s qualifications, the credibility and reputation of the publishing outlet, the presence of citations within the article, and the overall coherence and consistency of the research findings.
Q: Can I use a literature review map for disciplines outside of the humanities and social sciences?
A: Absolutely! While literature reviews are commonly associated with humanities and social sciences, they are applicable to any academic field. Whether you are conducting research in the sciences, engineering, or any other discipline, a literature review map will help you organize and present the relevant scholarly literature specific to your research topic.
By following these step-by-step guidelines, you can create a comprehensive literature review map that will serve as a valuable tool throughout your research. Remember to regularly update and refine your map as you progress in your studies. A well-organized literature review will not only demonstrate your knowledge and understanding of the field, but also provide a solid foundation for your own research and contribute to the wider scholarly conversation.
Understanding the Advantages of SATA Hard Drives
3) top 10 wordpress website packages for beginners.
Recent Posts
Driving Organic Growth: How a Digital SEO Agency Can Drive Traffic to Your Website
Mastering Local SEO for Web Agencies: Reaching Your Target Market
The Ultimate Guide to Unlocking Powerful Backlinks for Your Website
SEO vs. Paid Advertising: Finding the Right Balance for Your Web Marketing Strategy
Discover the Secret Weapon for Local SEO Success: Local Link Building Services
Popular Posts
Shocking Secret Revealed: How Article PHP ID Can Transform Your Website!
Unlocking the Secrets to Boosting Your Alexa Rank, Google Pagerank, and Domain Age – See How You Can Dominate the Web!
Uncovering the Top Secret Tricks for Mastering SPIP PHP – You Won’t Believe What You’re Missing Out On!
The Ultimate Collection of Free Themes for Google Sites
Discover the Shocking Truth About Your Website’s Ranking – You Won’t Believe What This Checker Reveals!
Explore topics.
Backlinks (2,425)
Blog (2,744)
Computers (5,318)
Digital Marketing (7,741)
Internet (6,340)
Website (4,705)
Wordpress (4,705)
Writing Articles & Reviews (4,208)
Something went wrong when searching for seed articles. Please try again soon.
No articles were found for that search term.
Author, year The title of the article goes here
LITERATURE REVIEW SOFTWARE FOR BETTER RESEARCH
“Litmaps is a game changer for finding novel literature... it has been invaluable for my productivity.... I also got my PhD student to use it and they also found it invaluable, finding several gaps they missed”
Varun Venkatesh
Austin Health, Australia
As a full-time researcher, Litmaps has become an indispensable tool in my arsenal. The Seed Maps and Discover features of Litmaps have transformed my literature review process, streamlining the identification of key citations while revealing previously overlooked relevant literature, ensuring no crucial connection goes unnoticed. A true game-changer indeed!
Ritwik Pandey
Doctoral Research Scholar – Sri Sathya Sai Institute of Higher Learning
Using Litmaps for my research papers has significantly improved my workflow. Typically, I start with a single paper related to my topic. Whenever I find an interesting work, I add it to my search. From there, I can quickly cover my entire Related Work section.
David Fischer
Research Associate – University of Applied Sciences Kempten
“It's nice to get a quick overview of related literature. Really easy to use, and it helps getting on top of the often complicated structures of referencing”
Christoph Ludwig
Technische Universität Dresden, Germany
“This has helped me so much in researching the literature. Currently, I am beginning to investigate new fields and this has helped me hugely”
Aran Warren
Canterbury University, NZ
“I can’t live without you anymore! I also recommend you to my students.”
Professor at The Chinese University of Hong Kong
“Seeing my literature list as a network enhances my thinking process!”
Katholieke Universiteit Leuven, Belgium
“Incredibly useful tool to get to know more literature, and to gain insight in existing research”
KU Leuven, Belgium
“As a student just venturing into the world of lit reviews, this is a tool that is outstanding and helping me find deeper results for my work.”
Franklin Jeffers
South Oregon University, USA
“Any researcher could use it! The paper recommendations are great for anyone and everyone”
Swansea University, Wales
“This tool really helped me to create good bibtex references for my research papers”
Ali Mohammed-Djafari
Director of Research at LSS-CNRS, France
“Litmaps is extremely helpful with my research. It helps me organize each one of my projects and see how they relate to each other, as well as to keep up to date on publications done in my field”
Daniel Fuller
Clarkson University, USA
As a person who is an early researcher and identifies as dyslexic, I can say that having research articles laid out in the date vs cite graph format is much more approachable than looking at a standard database interface. I feel that the maps Litmaps offers lower the barrier of entry for researchers by giving them the connections between articles spaced out visually. This helps me orientate where a paper is in the history of a field. Thus, new researchers can look at one of Litmap's "seed maps" and have the same information as hours of digging through a database.
Baylor Fain
Postdoctoral Associate – University of Florida
We use cookies to ensure that we give you the best experience on our website. If you continue to use this site we will assume that you are happy with it.
How to Master at Literature Mapping: 5 Most Recommended Tools to Use
This article is also available in: Turkish , Spanish, Russian , and Portuguese
After putting in a lot of thought, time, and effort, you’ve finally selected a research topic . As the first step towards conducting a successful and impactful research is completed, what follows it is the gruesome process of literature review . Despite the brainstorming, the struggle of understanding how much literature is enough for your research paper or thesis is very much real. Unlike the old days of flipping through pages for hours in a library, literature has come easy to us due to its availability on the internet through Open Access journals and other publishing platforms. This ubiquity has made it even more difficult to cover only significant data! Nevertheless, an ultimate solution to this problem of conglomerating relevant data is literature mapping .
Table of Contents
What is Literature Mapping?
Literature mapping is one of the key strategies when searching literature for your research. Since writing a literature review requires following a systematic method to identify, evaluate, and interpret the work of other researchers, academics, and practitioners from the same research field, creating a literature map proves beneficial. Mapping ideas, arguments, and concepts in a literature is an imperative part of literature review. Additionally, it is stated as an established method for externalizing knowledge and thinking processes. A map of literature is a “graphical plan”, “diagrammatic representation”, or a “geographical metaphor” of the research topic.
Researchers are often overwhelmed by the large amount of information they encounter and have difficulty identifying and organizing information in the context of their research. It is recommended that experts in their fields develop knowledge structures that are richer not only in terms of knowledge, but also in terms of the links between this knowledge. This knowledge linking process is termed as literature mapping .
How Literature Mapping Helps Researchers?
Literature mapping helps researchers in following ways:
It provides concrete evidence of a student’s understanding and interpretation of the research field to share with both peers and professors.
Switching to another modality helps researchers form patterns to see what might otherwise be hidden in the research area.
Furthermore, it helps in identifying gaps in pertinent research.
Finally, t lets researchers identify potential original areas of study and parameters of their work.
How to Make a Literature Map?
Literature mapping is not only an organizational tool, but also a reflexive tool. Furthermore, it distinguishes between declarative knowledge shown by identifying key concepts, ideas and methods, and procedural knowledge shown through classifying these key concepts and establishing links or relationships between them. The literature review conceptualizes research structures as a “knowledge production domain” that defines a productive and ongoing constructive element. Thus, the approaches emphasize the identity of different scientific institutions from different fields, which can be mapped theoretically, methodologically, or fundamentally.
The two literature mapping approaches are:
Mapping with key ideas or descriptors: This is developed from keywords in research topics.
Author mapping: This is also termed as citation matching that identifies key experts in the field and may include the use of citations to interlink them.
Generally, literature maps can be subdivided by categorization processes based on theories, definitions, or chronology, and cross-reference between the two types of mapping. Furthermore, researchers use mind maps as a deductive process, general concept-specific mapping (results in a right triangle), or an inductive process mapping to specific concepts (results in an inverted triangle).
What are Different Literature Mapping Methods?
The different types of literature mapping and representations are as follows:
1. Feature Mapping:
Argument structures developed from summary registration pages.
2. Topic Tree Mapping:
Summary maps showing the development of the topic in sub-themes up to any number of levels.
3. Content Mapping:
Linear structure of organization of content through hierarchical classification.
4. Taxonomic Mapping:
Classification through standardized taxonomies.
5. Concept Mapping:
Linking concepts and processes allows procedural knowledge from declarative information. With a basic principle of cause and effect and problem solving, concept maps can show the relationship between theory and practice.
6. Rhetorical Mapping:
The use of rhetoric communication to discuss, influence, or persuade is particularly important in social policy and political science and can be considered a linking strategy. A number of rhetorical tools have been identified that can be used to present a case, including ethos, metaphor, trope, and irony.
7. Citation Mapping:
Citation mapping or matching is a research process established to specifically establish links between authors by citing their articles. Traditional manual citation indexes have been replaced by automated databases that allow visual mapping methods (e.g. ISI Web of Science). In conclusion, citation matching in a subject area can be effective in determining the frequency of authors and specific articles.
5 Most Useful Literature Mapping Tools
Technology has made the literature mapping process easier now. However, with numerous options available online, it does get difficult for researchers to select one tool that is efficient. These tools are built behind explicit metadata and citations when coupled with some new machine learning techniques. Here are the most recommended literature mapping tools to choose from:
1. Connected Papers
a. Connected Papers is a simple, yet powerful, one-stop visualization tool that uses a single starter article.
b. It is easy to use tool that quickly identifies similar papers with just one “Seed paper” (a relevant paper).
c. Furthermore, it helps to detect seminal papers as well as review papers.
d. It creates a similarity graph not a citation graph and connecting lines (based on the similarity metric).
e. Does not necessarily show direct citation relationships.
f. The identified papers can then be exported into most reference managers like Zotero, EndNote, Mendeley, etc.
2. Inciteful
a. Inciteful is a customizable tool that can be used with multiple starter articles in an iterative process.
b. Results from multiple seed papers can be imported in a batch with a BibTex file.
c. Inciteful produces the following lists of papers by default:
Similar papers (uses Adamic/Adar index)
“Most Important Papers in the Graph” (based on PageRank)
Recent Papers by the Top 100 Authors
The Most Important Recent Papers
d. It allows filtration of results by keywords.
e. Importantly, seed papers can also be directly added by title or DOI.
a. Litmaps follows an iterative process and creates visualizations for found papers.
b. It allows importing of papers using BibTex format which can be exported from most reference managers like Zotero, EndNote, Mendeley. In addition, it allows paper imports from an ORCID profile.
c. Keywords search method is used to find Litmaps indexed papers.
d. Additionally, it allows setting up email updates of “emergent literature”.
e. Its unique feature that allows overlay of different maps helps to look for overlaps of papers.
f. Lastly, its explore function allows finding related papers to add to the map.
4. Citation-based Sites
a. CoCites is a citation-based method for researching scientific literature.
b. Citation Gecko is a tool for visualizing links between articles.
c. VOSviewer is a software tool for creating and visualizing bibliometric networks. These networks are for example journals, may include researchers or individual publications, which can be generated based on citation, bibliographic matching , co-citation, or co-authorship relationships. VOSviewer also offers text mining functionality that can be used to create and visualize networks of important terms extracted from a scientific literature.
5. Citation Context Tools
a. Scite allow users to see how a publication has been cited by providing the context of the citation and a classification describing whether it provides supporting or contrasting evidence for the cited claim.
b. Semantic Scholar is a freely available, AI-powered research tool for scientific literature.
Have you ever mapped your literature? Did you use any of these tools before? Lastly, what are the strategies and methods you use for literature mapping ? Let us know how this article helped you in creating a hassle-free and comprehensive literature map.
It’s very good and detailed.
It’s very good and clearly . It teaches me how to write literature mapping.
Rate this article Cancel Reply
Your email address will not be published.
Enago Academy's Most Popular Articles
Promoting Research
Thought Leadership
Trending Now
How Enago Academy Contributes to Sustainable Development Goals (SDGs) Through Empowering Researchers
The United Nations Sustainable Development Goals (SDGs) are a universal call to action to end…
Reporting Research
AI Assistance in Academia for Searching Credible Scholarly Sources
The journey of academia is a grand quest for knowledge, more specifically an adventure to…
Language & Grammar
Best Plagiarism Checker Tool for Researchers — Top 4 to choose from!
While common writing issues like language enhancement, punctuation errors, grammatical errors, etc. can be dealt…
Industry News
Publishing News
2022 in a Nutshell — Reminiscing the year when opportunities were seized and feats were achieved!
It’s beginning to look a lot like success! Some of the greatest opportunities to research…
Manuscripts & Grants
Writing a Research Literature Review? — Here are tips to guide you through!
Literature review is both a process and a product. It involves searching within a defined…
2022 in a Nutshell — Reminiscing the year when opportunities were seized and feats…
Sign-up to read more
Subscribe for free to get unrestricted access to all our resources on research writing and academic publishing including:
2000+ blog articles
50+ Webinars
10+ Expert podcasts
50+ Infographics
10+ Checklists
Research Guides
We hate spam too. We promise to protect your privacy and never spam you.
I am looking for Editing/ Proofreading services for my manuscript Tentative date of next journal submission:
What would be most effective in reducing research misconduct?
6 ways to use concept mapping in your research
Joseph Novak developed concept mapping in the 1970s and ever since, it has been used to present the construction of knowledge. A concept map is a great way to present all the moving parts of your research project in one visually appealing figure. I recommend using this technique when you start thinking about your new research topic all the way through to the end product, and once you submitted your thesis, dissertation or research article, you can use concept mapping to plan your next project. If you prefer to watch the video explaining the 6 steps, scroll down.
What is the purpose of concept mapping?
You may wonder what the purpose of a concept map is. A concept map shows the different “ideas” which form part of your research project, as well as the relationships between them. A concept map is a visual presentation of concepts as shapes, circles, ovals, triangles or rectangles, and the relationships between these concepts are presented by arrows. Your concept map will show the concept in words inside a shape, and the relationship is then presented in words next to each arrow, so that each branch reads like a sentence. What is the difference between a mind map and a concept map? A mind map is different from a concept map in that a mind map puts much less emphasis on the relationship between concepts.
How to use a concept map in your research
Don’t wait to put your concept map together until only after you have, what you consider, “all the knowledge” and have read “all the literature” (anyway, with two million research articles published each year, will that day ever come?). In the very early stages, when you start thinking about your research project, draw your concept map to get your thoughts organised. Then, as you become more and more abreast with the research out there, modify your concept map.
The process of creating a concept map is an iterative one and you will find that it feels like you have drawn and redrawn the map over and over so many times that you wonder if you are ever going to get to a final version. This process in itself is a learning experience and is vital to sort the concepts out for yourself. If you have clarity in your own head, it is easier to explain what your research is all about to someone else. In addition, including a concept map into a dissertation, thesis, or research article (where relevant) makes it easier for the reader (including the examiner or reviewer) to understand what your research project is all about. There are several instances in your research journey where a concept map will come in handy.
#1 Use a concept map to brainstorm your research topic
When you are conceptualising your research topic, create a concept map to put all the different aspects related to your research topic onto paper and to show the relationships between them. This will give you a bird’s eye view of all the moving parts associated with the chosen research topic. You will also, most probably, realise that the topic is too broad, and you’ll be able to zoom in a bit more to focus your research question better. But before you settle on a specific research question, do a bit of reading around the topic area. Your concept map will show you which keywords to search for.
#2 Use a concept map when planning the search strategy for your literature review
Jumping right into those databases to do a search for articles to include in your literature review can really take you down the deepest darkest rabbit hole. One of those where you find an appropriate article, then gets suggested a few related articles and then you find another few related articles to the related articles, and after 4 hours you can’t even remember what your actual focus was. To avoid this situation, draw your concept map first. You can use the concept map you drew when you brainstormed your research topic to give you guidance in terms of the keywords to search for. Planning your search strategy before you jump in will ensure that you remain on the well-lit path.
#3 Add a concept map to your completed literature review chapter
As you read more about your research topic, you’ll get a better idea of the relationships between the current concepts, and you’ll find more concepts to add to your concept map. Adapt your concept map as you go along, and once you have the final version of your literature review, add your concept map as a figure to your literature review chapter. This will give the reader a good overview of your literature review and it will make their hearts happy because we all know how nice it is to be rewarded with a picture after reading pages and pages of text.
#4 Use a concept map to plan your discussion
Once you completed your data analysis and interpretation, developing a concept map for your discussion will give you clarity on what to include in your discussion chapter or section.
#5 Add a concept map to your completed research project
Once you have completed your entire research project and you want to show how your findings filled a gap in the literature, you can indicate this by modifying the concept map which you created for our literature review. This is a great way to show how your research findings have added to the existing concepts related to your research topic.
#6 Use a concept map to show your research niche area
You can use a concept map to visually present your own research niche area and as your career progresses and you create more knowledge in a specific niche, you can add to your concept map.
How to make a concept map for research
Go to a place where there are very few distractions, a place that is conducive to letting those creative juices flow freely. Seeing that we all function differently, shall I rather say, a place which you perceive as having few distractions. It may be in a park, in your garden, at a restaurant, in the library or in your own study.
Take out a blank piece of paper and start thinking about your research project. Of course, you can do it on a blank page on your laptop as well. One of my students used sticky notes with each sticky note presenting a concept, and with smaller strips of sticky notes showing the relationships between concepts. You can even get all fancy and use concept mapping software. But as a start, a blank piece of paper is more than enough.
Jot down all the ideas that come to mind while you answer the following questions: What is your research about? Why is your research important? What gap does your research fill? What problem will your research solve? What influences your research outcome? Just jot all your thoughts down. Then, once you have all your thoughts on paper, see if you can identify some relationships between the concepts which you noted down. What comes before what? What is a consequence of what? What is associated with what?
Once you are happy with what you have put together, present it to a friend, preferably at a time when both of you are not in a hurry to get somewhere. At a bar with loud music may not work well, and on a first date may also not be a good idea. Explain what is going on in the concept map and give your friend a chance to ask some questions. As you explain it to someone, as well as through fielding your friend’s questions, it will start to make more sense to you, and you will most probably move some concepts around and add new ones. Repeat this process with someone else when you feel you need some more input.
If you are planning to feature your concept map in your thesis, dissertation or research article, now is the time to turn your rough concept map into something more presentable. One can easily get totally lost when it comes to choosing software to create a concept map. Some of the software out there is paid for while others give you a free version for some basic concept mapping. Be careful of that software which only gives you free access for 30 days, remember, you are going to change your concept map quite a few times as time goes on. If you prefer to use software which you are already familiar with, why not just do it in PowerPoint or Word? On the other hand, Lucidchart is really user-friendly. Watch the video below to see how easy it is to create a concept map with Lucidchart. Explore a few options and see what works for you, but be careful, this exploration can take you down that 4-hour rabbit hole and when a proposal submission deadline is looming, that rabbit hole is a dark place to be in.
We'd like to acknowledge Coffee Machine Cleaning for the image of the coffee cup and notebook used in this blog post.
Examples of concept maps
Here are a few examples of concept maps that show the concepts and the relationship between the concepts well. Click on the image to visit the original source. Go and enjoy developing a concept map for your research!
One last thing before you go, for more valuable content related to academic research, subscribe to the Research Masterminds YouTube Channel and hit the bell so that you get notified when I upload a new video. If you are a (post)graduate student working on a masters or doctoral research project, and you are passionate about life, adamant about completing your studies successfully and ready to get a head-start on your academic career, this opportunity is for you! Join our awesome membership site - a safe haven offering you coaching, community and content to boost your research experience and productivity. Check it out! https://www.researchmasterminds.com/academy .
Example 1 Little Red Riding Hood
Example 2 Nursing Management
Example 3 Operations Management
Example 4 Cup of Coffee
Example 5 Flexibility
Example 6 Human Body Systems
Example 7 Simple Concept Map Template
If you prefer to watch the video, here it is:
Leave a comment
DOI: 10.1007/S11135-021-01113-X
Corpus ID: 233915877
A literature review of open-ended concept maps as a research instrument to study knowledge and learning
Kirsten E. de Ries , H. Schaap , +2 authors P. Meijer
Published in Quality & Quantity… 24 February 2021
24 Citations
Digital cognitive maps for scientific knowledge construction in initial teacher education.
Highly Influenced
Belonging and participation as portrayed in the curriculum guidelines of five European countries
The role of scientific language use and achievement level in student sensemaking, capturing evaluation capacity: findings from a mapping of evaluation capacity instruments, the impact of the 5e learning model improved with concept maps on motivation, design and implementation of a teaching scenario for primary school students on creating a school garden using inquiry method, interrelatedness patterns of knowledge representation in extension concept mapping, knowledge reconstruction with kit-build concept map: a review from student experience, embracing the inclusion of societal concepts in biology improves student understanding, using evaluative information sensibly: the enduring contributions of john mayne, 63 references, how a qualitative approach to concept map analysis can be used to aid learning by illustrating patterns of conceptual development, thinking through and designing qualitative research studies: a focused mapping review of 30 years of qualitative research in sport psychology, formative and summative assessment of concept maps, what do eesd “experts” think sustainability is which pedagogy is suitable to learn it: results from interviews and cmaps analysis gathered at eesd 2008, mapping changes in science teachers’ content knowledge: concept maps and authentic professional development, problems and issues in the use of concept maps in science assessment., critical appraisal of mixed methods research studies in a systematic scoping review on plural policing: assessing the impact of excluding inadequately reported studies by means of a sensitivity analysis, assessing impacts of a learning-cycle-based module on students' conceptual sustainability knowledge using concept maps and surveys, on the use of concept maps as an assessment tool in science: what we have learned so far 1 el uso de mapas conceptuales como instrumento de evaluación del aprovechamiento en ciencias: lo que sabemos hasta ahora, framing experience: concept maps, mind maps, and data collection in qualitative research, related papers.
Showing 1 through 3 of 0 Related Papers
Understanding and solving intractable resource governance problems.
Conferences and Talks
Exploring models of electronic wastes governance in the United States and Mexico: Recycling, risk and environmental justice
The Collaborative Resource Governance Lab (CoReGovLab)
Water Conflicts in Mexico: A Multi-Method Approach
Past projects
Publications and scholarly output
Research Interests
Higher education and academia
Public administration, public policy and public management research
Research-oriented blog posts
Stuff about research methods
Research trajectory
Publications
Developing a Writing Practice
Outlining Papers
Publishing strategies
Writing a book manuscript
Writing a research paper, book chapter or dissertation/thesis chapter
Teaching Public Policy, Public Administration and Public Management
My Reading Notes of Books on How to Write a Doctoral Dissertation/How to Conduct PhD Research
Writing a Thesis (Undergraduate or Masters) or a Dissertation (PhD)
Reading strategies for undergraduates
Social Media in Academia
Resources for Job Seekers in the Academic Market
Writing Groups and Retreats
Regional Development (Fall 2015)
State and Local Government (Fall 2015)
Public Policy Analysis (Fall 2016)
Regional Development (Fall 2016)
Public Policy Analysis (Fall 2018)
Public Policy Analysis (Fall 2019)
Public Policy Analysis (Spring 2016)
POLI 351 Environmental Policy and Politics (Summer Session 2011)
POLI 352 Comparative Politics of Public Policy (Term 2)
POLI 375A Global Environmental Politics (Term 2)
POLI 350A Public Policy (Term 2)
POLI 351 Environmental Policy and Politics (Term 1)
POLI 332 Latin American Environmental Politics (Term 2, Spring 2012)
POLI 350A Public Policy (Term 1, Sep-Dec 2011)
POLI 375A Global Environmental Politics (Term 1, Sep-Dec 2011)
How to do a literature review: Citation tracing, concept saturation and results’ mind-mapping
There is a number of academics (and coaches and consultants) who have both a strong presence online and do a marvellous job of writing excellent blog posts as guidance for undergraduate, graduate students and early career professors. Two of my favourite who write specifically about literature reviews are How To Do a Literature Review (written by Aurelie) and Literature Review HeadQuarters (written by Ben – see this helpful post of his on when to say “ I already have enough literature, thankyouverymuch “). I would refer you to their websites so that you can learn a lot more about how to do literature reviews. Recently, I was asked to write about how I do literature reviews . I could simply point you to Ben and Aurelie’s blogs, but I figured I could contribute something to the list of posts on academic workflow techniques.
In my case, there are a number of things I could share about how to write a literature review, but I want to focus on 3 major themes that I think are important to the way in which I write my own literature reviews: citation tracing, concept saturation and mind-mapping of results. These three concepts are interrelated and quite relevant for anybody writing a literature review.
First, to find whether you have read everything you need, you must engage in citation tracing : you will need to find the key references across the literature for your particular project. Then, you need to map whether your literature review has reached concept saturation : have you exhausted the field for the specific topic you are working on? And finally, you will need to lay out how different citations, bodies of work and key concepts relate to each other. I normally do this using the technique named mind-mapping .
Citation Tracing: Citation tracing refers to the activity wherein we trace which authors cite which work, and the relationships across these cites. For me, citation tracing is fundamental, because it allows me to see whether there is a gap in the literature, and how each author is working through the concepts. For example, I have seen about 4 articles on the human right to water and how to implement it from a policy perspective. None of these articles actually link to the literature on policy implementation. They talk abstractly about policy implementation of the human right to water, but they fail to link to the literature. How did I know this? Because not only did I read the article, but also looked through the reference list. I did not recognize any articles that were specific to the policy implementation literature (a body of works that I know very well given that I teach the omnibus course on public policy theories).
There are different ways to do citation tracing. Aurelie offers a good overview using Google Scholar . Generally speaking, I combine two methods: the first one is a Google Scholar backtracking search . I search on Google Scholar for the keywords I aim to do, and restrict the search to the last two or three years. This allows me to find a few (generally 4-5) relevant articles, which I then try to read and write a memo (if I decide using my triage technique that memo-ing the paper is worth my time). As you can see, I searched Google Scholar for “ethical bottled water” and found a few articles that are relevant. The problem with Google Scholar is that sometimes, depending on the keywords and sequence, you end up having to sift through several pages’ worth of results. In this case, both the Hawkins and Brei and Bohm articles are present in both searches, which means they might be relevant to my search.
As you can see, the set of results and citations you will get changing the wording slightly may be completely different, which is why it is important to make sure that you use different combinations of keywords. See the results of a different set of keywords related to ethics, branding and bottled water.
The second one is a narrow Mendeley keyword search , as I show in the figure below. I search my 6,000 entries’ database on Mendeley for specific keywords. Usually (and Mendeley is very good at this), the top 5 items in the search will be pretty relevant to what I am trying to find. Below you can see the citations for the top 5 entries that are specific to “human right to water”, “policy” and “implementation”.
In both cases, what I do is I read the article, then quickly search through the references’ list and make sure that I have read some of the references. I usually find one or two articles that are very relevant to my research and that have been cited often. I highlight those, and remark if I have read them, or if I haven’t, whether they look relevant enough to try and find them and read them. Here is where concept saturation comes in.
Concept saturation: I define concept saturation as the point where I am seeing the same citations repeated on a regular basis. I borrow this term from qualitative research methods, as it is also the point when you are seeing the same concepts repeated over and over again. For example, I think much of the work around ethical bottled water has been done in the marketing literature from a branding perspective. Methodologically, I have seen most of the work using qualitative discourse analysis. So, when I start seeing yet another piece on bottled water branding using qualitative methods, I think I have reached concept saturation. Time to skip to a different approach. For example, the work of Gay Hawkins has been fundamental in developing the notion of bottled water as an assemblage. I have looked through basically all her citations, and read all her work. See the Mendeley search below.
Basically, I have used Gay Hawkins’ work to map everything scholarly that there is and that is related to a “material culture” approach to understanding bottled water. Once I found that every single author I had in the short list of cites that I had to review in my citation tracing process were associated or citing Hawkins’ work, I knew I had reached concept saturation. Another idea that I have seen floating in the bottled water literature is the idea of “accumulation by dispossession” promoted by David Harvey, and implemented by Jaffee and Newman , so I went and read their work until I found no more citations associated with this idea.
Results’ mind-mapping Finally, once I’ve read a number of papers using citation tracing (seeing who has cited whom, and whether their work is useful), and to ensure concept saturation, I map these citing relationships and ideas in a mind map. Results’ mind mapping is important because it allows you to both have a clear overview of the literature and a map of who is citing whom, and where your own work may fit, as well as the different gaps in the literature you might be able to fill with your own research and literature review. To do these mind maps, many people use mind mapping software, but I usually do it by hand. (UPDATE – I wrote a blog post on mind mapping using MindManager from MindJet . The downside: IT’S SUPER EXPENSIVE)
Below, I show a brief and incomplete mind map of the literature on policy transfer, policy learning and policy convergence. If you are a scholar of public policy, most likely you will recognize these names.
Obviously you can make the results’ mind map as large as you may need it. When I am mapping a large body of literature I usually do it on a whiteboard or corkboard and use Post-It adhesive notes (one per each relevant author or concept). Then I link the different ideas in the mind map using different materials, depending on which surface I use to create the mind map. I also love putting the mind map on paper digitally, using mindmapping software like MindManager .
I am hopeful describing the processes I follow to undertake my literature review is helpful to you. I know it’s kind of weird for someone as connected and tech-savvy not to use a mind mapping technique that is more modern, but I am sure you can hardly find better tools than using hand-written notes.
You can share this blog post on the following social networks by clicking on their icon.
Posted in academia , research , research methods .
Tagged with academic writing , AcWri , literature review , productivity , research , research methods , writing .
By Raul Pacheco-Vega – June 15, 2016
6 Responses
Stay in touch with the conversation, subscribe to the RSS feed for comments on this post .
You point out very interesting strategies. I am now just beginning my lit review for my doctoral degree in Education. I see you show pictures of printed articles. This is something I’ve been debating. In your opinion, is it easier to do the lit review by printing out the articles or by reading them as PDFs? I understand this might be a personal preference, but was wondering what you thought about it. Thanks, Luisa
Personally, I think it’s better to print. I am unable to process digital sources in the same way as I do printed ones.
Unfortunately it looks like two of the sites you link, howtodoaliteraturereview.com and literaturereviewhq.com, have disappeared! Do you know if these sites have moved to a different location, or if they have been erased permanently?
Apparently both of these have been shutdown, which is very unfortunate.
Maybe the internet wayback machine can help. https://web.archive.org/web/20170209131233/http://www.howtodoaliteraturereview.com/
Continuing the Discussion
[…] have written a lot about how to do proper citation tracing (both forward and backward) to search who has cited whom and facilitate proper attribution of […]
Leave a Reply Cancel Some HTML is OK
Name (required)
Email (required, but never shared)
or, reply to this post via trackback .
About Raul Pacheco-Vega, PhD
Find me online.
My Research Output
Google Scholar Profile
Academia.Edu
ResearchGate
My Social Networks
Polycentricity Network
Recent Posts
My experience teaching residential academic writing workshops
“State-Sponsored Activism: Bureaucrats and Social Movements in Brazil” – Jessica Rich – my reading notes
Reading Like a Writer – Francine Prose – my reading notes
Using the Pacheco-Vega workflows and frameworks to write and/or revise a scholarly book
On framing, the value of narrative and storytelling in scholarly research, and the importance of asking the “what is this a story of” question
Recent Comments
Alan Parker on Project management for academics I: Managing a research pipeline
André Mascarenhas on On multiple academic projects’ management, time management and the realities of what we think we can accomplish in a certain period of time versus the realities of what we actually are able to.
Hazera on On framing, the value of narrative and storytelling in scholarly research, and the importance of asking the “what is this a story of” question
Kipi Fidelis on A sequential framework for teaching how to write good research questions
Razib Paul on On framing, the value of narrative and storytelling in scholarly research, and the importance of asking the “what is this a story of” question
Follow me on Twitter:
Proudly powered by WordPress and Carrington .
Carrington Theme by Crowd Favorite
Locations and Hours
UCLA Library
Research Guides
Biomedical Library Guides
Systematic Reviews
Types of Literature Reviews
What Makes a Systematic Review Different from Other Types of Reviews?
Planning Your Systematic Review
Database Searching
Creating the Search
Search Filters and Hedges
Grey Literature
Managing and Appraising Results
Further Resources
Reproduced from Grant, M. J. and Booth, A. (2009), A typology of reviews: an analysis of 14 review types and associated methodologies. Health Information & Libraries Journal, 26: 91–108. doi:10.1111/j.1471-1842.2009.00848.x
Aims to demonstrate writer has extensively researched literature and critically evaluated its quality. Goes beyond mere description to include degree of analysis and conceptual innovation. Typically results in hypothesis or mode
Seeks to identify most significant items in the field
No formal quality assessment. Attempts to evaluate according to contribution
Typically narrative, perhaps conceptual or chronological
Significant component: seeks to identify conceptual contribution to embody existing or derive new theory
Generic term: published materials that provide examination of recent or current literature. Can cover wide range of subjects at various levels of completeness and comprehensiveness. May include research findings
May or may not include comprehensive searching
May or may not include quality assessment
Typically narrative
Analysis may be chronological, conceptual, thematic, etc.
Mapping review/ systematic map
Map out and categorize existing literature from which to commission further reviews and/or primary research by identifying gaps in research literature
Completeness of searching determined by time/scope constraints
No formal quality assessment
May be graphical and tabular
Characterizes quantity and quality of literature, perhaps by study design and other key features. May identify need for primary or secondary research
Technique that statistically combines the results of quantitative studies to provide a more precise effect of the results
Aims for exhaustive, comprehensive searching. May use funnel plot to assess completeness
Quality assessment may determine inclusion/ exclusion and/or sensitivity analyses
Graphical and tabular with narrative commentary
Numerical analysis of measures of effect assuming absence of heterogeneity
Refers to any combination of methods where one significant component is a literature review (usually systematic). Within a review context it refers to a combination of review approaches for example combining quantitative with qualitative research or outcome with process studies
Requires either very sensitive search to retrieve all studies or separately conceived quantitative and qualitative strategies
Requires either a generic appraisal instrument or separate appraisal processes with corresponding checklists
Typically both components will be presented as narrative and in tables. May also employ graphical means of integrating quantitative and qualitative studies
Analysis may characterise both literatures and look for correlations between characteristics or use gap analysis to identify aspects absent in one literature but missing in the other
Generic term: summary of the [medical] literature that attempts to survey the literature and describe its characteristics
May or may not include comprehensive searching (depends whether systematic overview or not)
May or may not include quality assessment (depends whether systematic overview or not)
Synthesis depends on whether systematic or not. Typically narrative but may include tabular features
Analysis may be chronological, conceptual, thematic, etc.
Method for integrating or comparing the findings from qualitative studies. It looks for ‘themes’ or ‘constructs’ that lie in or across individual qualitative studies
May employ selective or purposive sampling
Quality assessment typically used to mediate messages not for inclusion/exclusion
Qualitative, narrative synthesis
Thematic analysis, may include conceptual models
Assessment of what is already known about a policy or practice issue, by using systematic review methods to search and critically appraise existing research
Completeness of searching determined by time constraints
Time-limited formal quality assessment
Typically narrative and tabular
Quantities of literature and overall quality/direction of effect of literature
Preliminary assessment of potential size and scope of available research literature. Aims to identify nature and extent of research evidence (usually including ongoing research)
Completeness of searching determined by time/scope constraints. May include research in progress
No formal quality assessment
Typically tabular with some narrative commentary
Characterizes quantity and quality of literature, perhaps by study design and other key features. Attempts to specify a viable review
Tend to address more current matters in contrast to other combined retrospective and current approaches. May offer new perspectives
Aims for comprehensive searching of current literature
No formal quality assessment
Typically narrative, may have tabular accompaniment
Current state of knowledge and priorities for future investigation and research
Seeks to systematically search for, appraise and synthesis research evidence, often adhering to guidelines on the conduct of a review
Aims for exhaustive, comprehensive searching
Quality assessment may determine inclusion/exclusion
Typically narrative with tabular accompaniment
What is known; recommendations for practice. What remains unknown; uncertainty around findings, recommendations for future research
Combines strengths of critical review with a comprehensive search process. Typically addresses broad questions to produce ‘best evidence synthesis’
Aims for exhaustive, comprehensive searching
May or may not include quality assessment
Minimal narrative, tabular summary of studies
What is known; recommendations for practice. Limitations
Attempt to include elements of systematic review process while stopping short of systematic review. Typically conducted as postgraduate student assignment
May or may not include comprehensive searching
May or may not include quality assessment
Typically narrative with tabular accompaniment
What is known; uncertainty around findings; limitations of methodology
Specifically refers to review compiling evidence from multiple reviews into one accessible and usable document. Focuses on broad condition or problem for which there are competing interventions and highlights reviews that address these interventions and their results
Identification of component reviews, but no search for primary studies
Quality assessment of studies within component reviews and/or of reviews themselves
Graphical and tabular with narrative commentary
What is known; recommendations for practice. What remains unknown; recommendations for future research
Important note: This article contains links to the Common Ground format of the Misconceptions Proceedings. For now, you should copy the title of the article you are interested, and then go to the PDF page for these articles , search for the title and view the relevant article.